
Visualization is the most important and enjoyable part of Machine learning (ML). How else would you make sense of the numerous observations, uncover relationships among attributes and support your claims? It is much easier to convince someone if you can back your report with easily understandable graphs. The colors and interesting shapes are but the cherry on the pie. On the one hand, you have libraries dedicated to the task of data visualization, such as Matplotlib (the grandpop of them all), GGPlot, Plotly, Bokeh. On the other, many data handling libraries like Pandas, Numpy and Scikit-learn now have inbuilt visualization functionalities by incorporating the likes of Matplotlib.
We can agree that everyone loves data visualization, and everyone loves to have datasets that can train powerful models. But what happens when the scale of the data reaches petabytes? Thus enters Apache Superset while the mainstream libraries cower in the corner on seeing massive datasets. Apache Superset springs into action to answer your business intelligence (BI) needs. It is lightweight and comes loaded with options that ML engineers possessing different technical expertise can use. One of the strengths of Apache Superset is its flexibility. Being cloud-native, it can fit on your laptop, containers as well as widely distributed environments. It lets you choose its accessory among web servers like Nginx, Apache, or Gunicorn, or message queues like Redis, RabbitMQ, or metadata engines like Postgres, MySQL, and so on. It also works well with different results from backend and caching layers and services like StatsD and DataDog.

Now, if you are wondering how to start with this powerful web application, please check out this super helpful Apache Superset tutorial. If the above World Bank Superset dashboard got you excited, you could build one of your own by following the steps of this Superset example dashboard. You will be glad to see familiar old pie and bar charts to more sophisticated plots among the options.

Apache Superset and Model Development
Apache Superset plays many important roles in machine learning model development. Firstly, it enables the visualization of large datasets that conventional libraries could not do. The generated visuals figure prominently in the data exploration stage because machine learning engineers need to be aware of its underlying properties no matter the size of the data at hand. The data stored in any cloud-hosted database would require ETL operations to pave the foundation for the modeling process. Secondly, since Superset can cater to many databases and query languages, the interactive dashboard elements like dropdown menus can filter the backend queries further. For this, Superset uses a built-in thin semantic layer that decides how data sources could get displayed in a dashboard. The layer provides control to the user as to which data attributes can be filtered using dropdowns.
What’s more? You can also decide if Superset should save computed values like SUM or COUNT and display them as separate items on the dashboard. This is useful flexibility that a good data visualization tool should offer.
The other end of model development involves viewing the predictions by the trained and tested model so the output can also be used to tune the model further. Superset can again be used to view the generated forecasts on rich dashboards. Superset can therefore facilitate major functions of a machine learning model lifecycle (ML model lifecycle).
The smooth functioning of MLOps requires MLOps tools that can interface with each other seamlessly and yet be flexible enough to not be affected by any underlying changes. For instance, you might start with a specific data engine to feed your data pipeline, but you might want to change it down the course. A typical machine learning lifecycle (ML lifecycle) is rife with such dynamic decisions. But fear not! Superset ships with SQLite By default, but you can easily find and install database connectivity packages through pip distribution. The list of supported databases and more information on the required drivers can be found on the Superset website here.
Comparison with Counterparts
Apache Superset is a powerful means to achieve intuitive visualizations of gigantic datasets. Moreover, you need not run to coding classes to get the best out of it. It can also cater to the universal database language SQL and supports other flavors. Superset also gives power to the user to create custom views and intricate controls. Since data handling also mandates security provisions, it can integrate with major authentication backends like OpenID, OAuth, LDAP, REMOTE_USER, etc. You can find more information on Superset open source and detailed discussion at Apache Superset review.
Superset can talk with any database that supports SQLAlchemy but lags when compared with Tableau for supported data sources. If your data needs extensive cleaning, then Tableau Prep does better. Also, Tableau offers security features for different granularities of team and individual. Additionally, Hyper DB integrated into Tableau results in faster loading of dashboards and subscription to reports to get notification emails. All this comes at a cost since Tableau is offered at different price ranges while Apache Superset being open-source, is available for free. Being more complex software, Tableau would also require a trained person for its optimal use.
Google Data Studio (GDS) is another widely used tool for free web-based visualization platforms. Despite coming from Google stables, organizations have been steadily moving to Apache Superset for reasons like easier usage, user role management, better filtering interface, and the active open-source community support. While GDS offers a variety of functionalities, slice and dice operations have been reported to be better on Superset. Moreover, the biggest advantage of GDS was its inherent association with the Google Cloud Services (GCS). But now, Superset offers connectivity to GCS as well.
Power BI by Microsoft was introduced as an add-on to MS Excel but became a full-fledged product in its own right. It offers a simple interface, a gentle learning curve, and smooth integration with Microsoft Azure and other sibling products. But unlike Superset, it cannot connect with as many database flavors due to a limited connection library. Also, it has been reported to run into performance issues for large datasets.
Looker is another BI tool that has a major appeal among users due to extensive functionalities, support for SQL, cloud support, and inbuilt machine learning language called LookML. Looker too offers a semantic layer, but it has a steep learning curve, and the product has an uncertain future after Google acquired it in 2019. The enterprise features like dashboard permissions, SaaS cloud option, role-based access are already offered by Superset open source. Also, Superset is more flexible to use since it supports languages like Python, ReactJS, and TypeScript. It is also more customizable and scalable, thereby preferred among the two.
The other two popular open-source BI visualization tools include Metabase and Redash. Metabase is lightweight yet suitable for extensive business needs; it too offers interactive dashboards, simple query language, and consistent community support. Redash, too, supports a large range of data sources, especially Cassandra. It was developed in Python like Superset. Superset again emerges as a frontrunner due to its support for backends for authentication support. Also, the access control in Metabase and Redash is more oriented towards groups, while Superset offers finer individual-specific granularity.
How to get the best out of Superset?
Apache Superset is a powerful tool and will suit your needs irrespective of your organization’s size. Here are some tips that can smoothen your experience
- Once installed, it should be run via Docker even if you plan to use Superset on one machine. Windows-based users should install an Ubuntu desktop virtual machine since there is no official support.
- It would help if you preferably used MySQL, PostgresSQL, and SQLite for production since Superset is tested using these. This prevents unforeseen integration issues.
- If you have made changes in the schema, please select ‘Sync columns from source’ in the Columns tab of the parent dataset. While this ensures that new columns have been merged, you may still need to update the table.
- If you need to plot geo-spatial visualizations, please register with mapbox.com first. The key that you will get post-registration should be assigned to the field MAPBOX_API_KEY in the superset_config.py
- For the filtering to be applied to all of the columns, please mark the column tab of the table editor as “filterable”
- In case you don’t want certain widgets to be filtered, please edit the JSON metadata field called the filter_immune_slices and pass the identifiers of the slices you wish to keep immune from dashboard level filtering
**
Thank you for reading. We hope that you find Apache Superset as powerful as we did, and our analysis would help you get the most out of it.
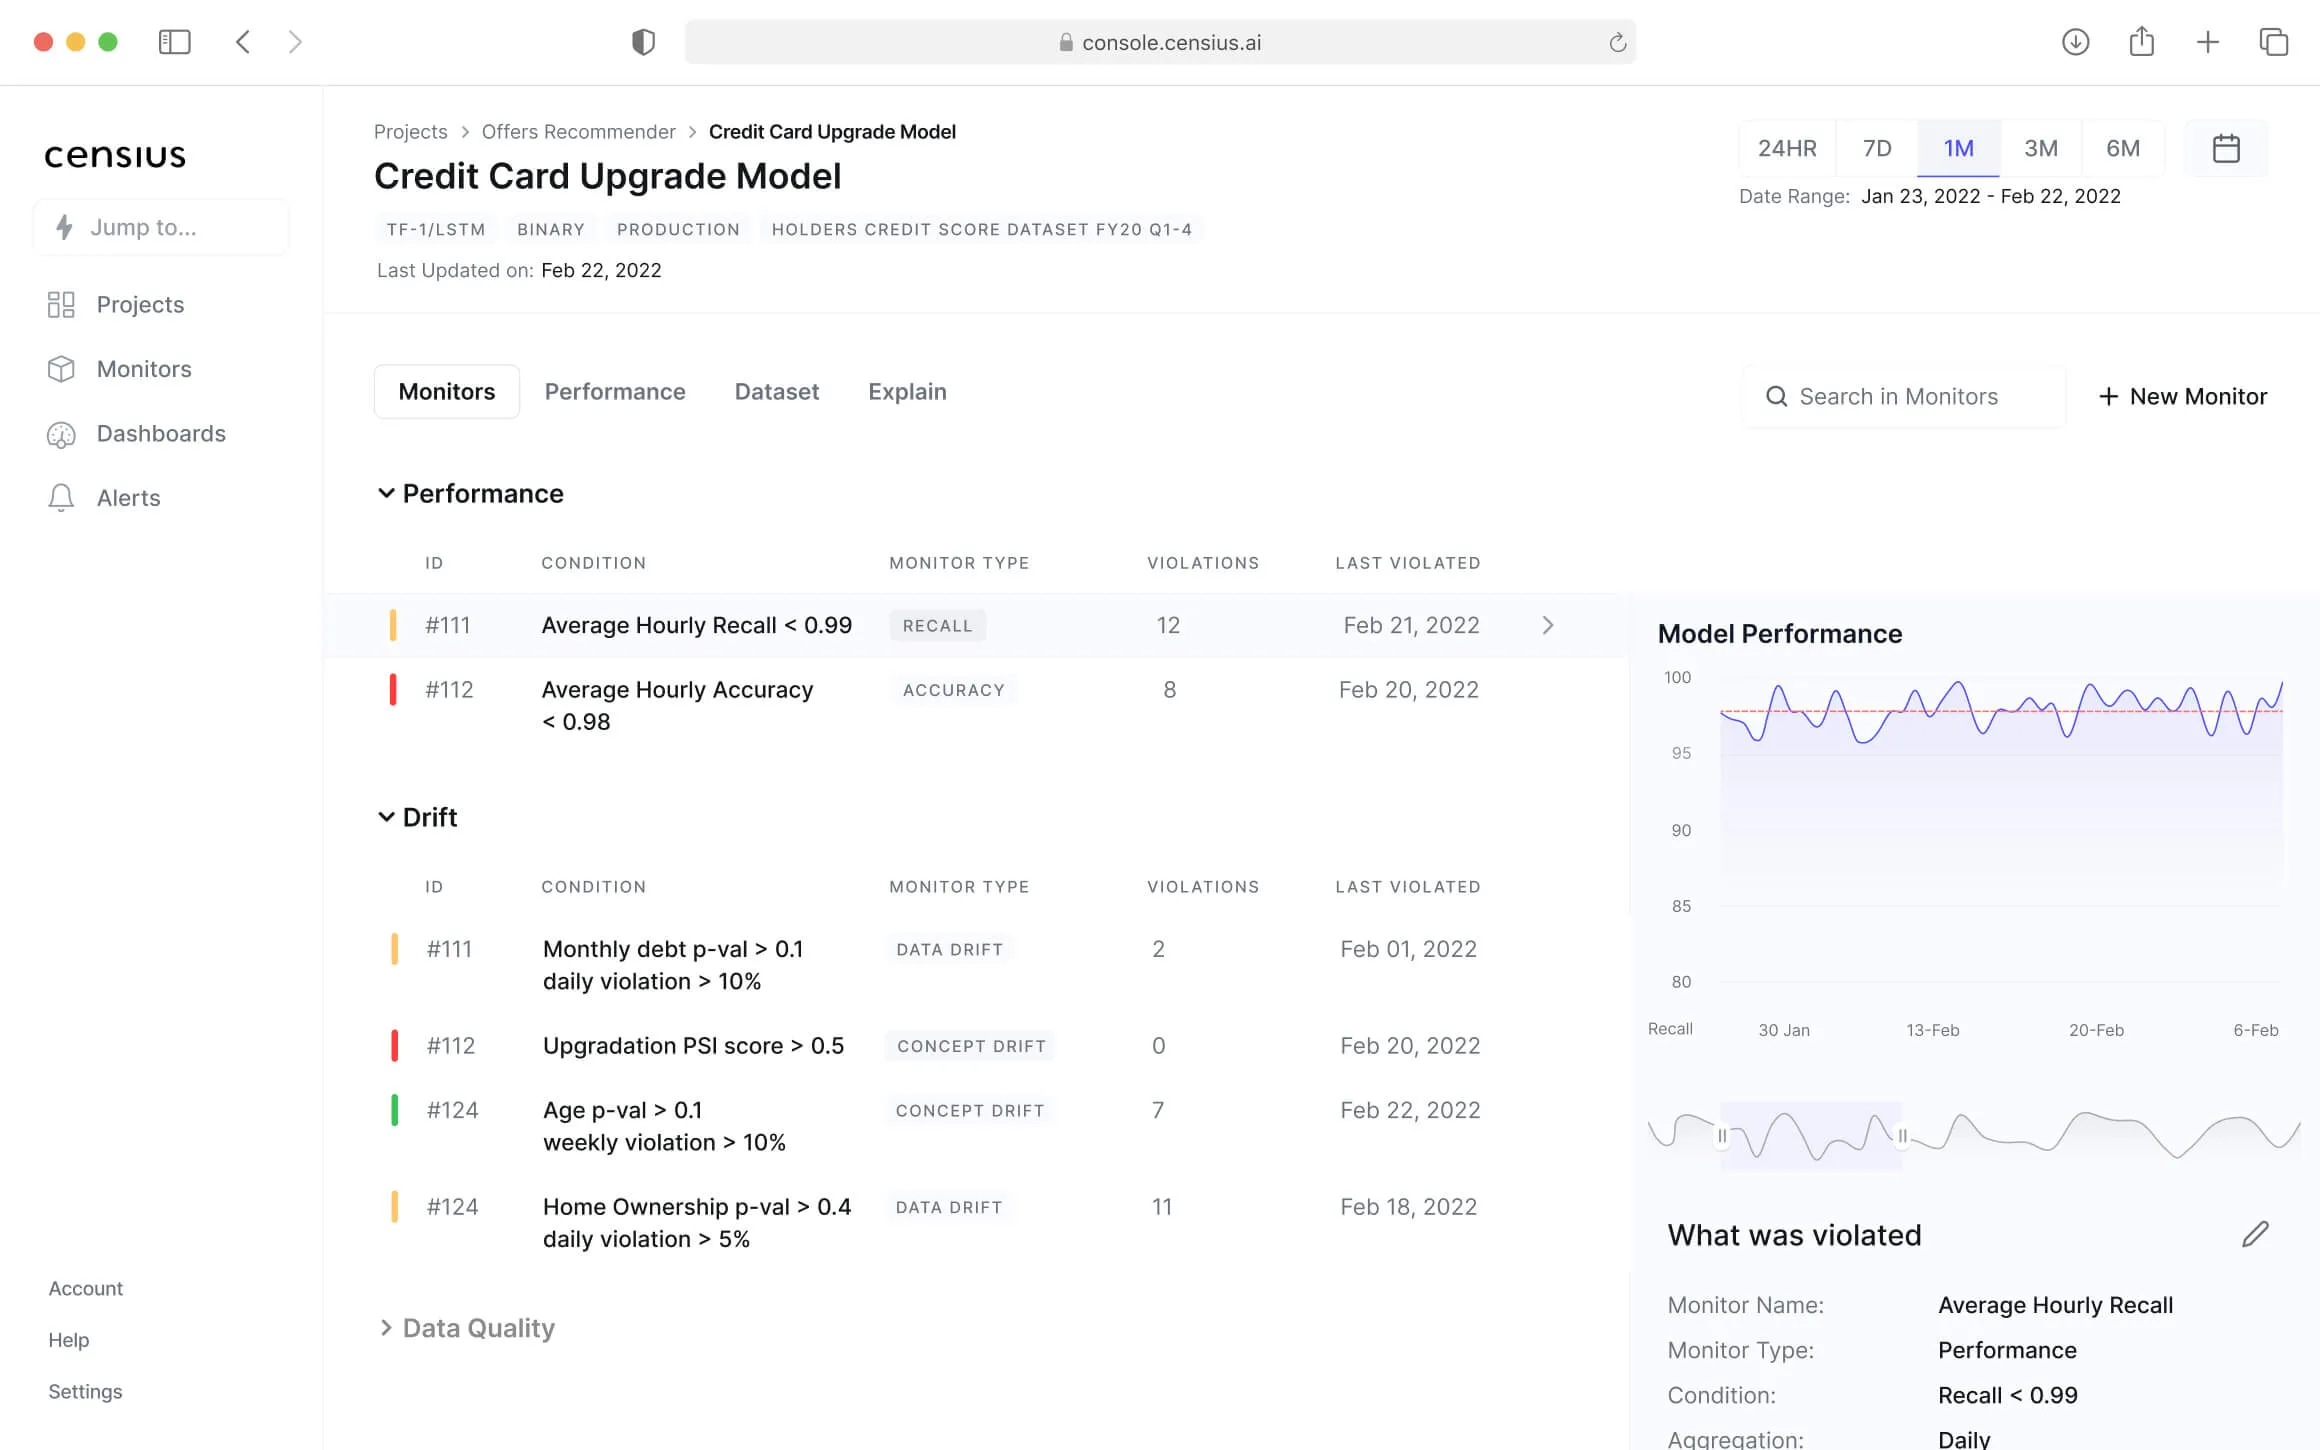
PS: Speaking of visualization, are you ready to take your model visualization to another level? Start exploring the power of visualization with Censius AI! Try it out for yourself and see how easy it is to build beautiful, interactive dashboards that provide actionable insights.
Sign up for a free trial today and start creating your own custom visualizations in minutes.
Explore how Censius helps you monitor, analyze and explain your ML models
Explore Platform