
Apache Superset plays many important roles in machine learning model development. Firstly, it enables the visualization of large datasets that conventional libraries like Pandas and Numpy could not do. This is a significant benefit as machine learning engineers (ML engineers) find data exploration an integral part of the Machine learning model lifecycle (ML model lifecycle or ML lifecycle). Secondly, you can build interactive dashboards that hold answers to all the questions a viewer might have about a business problem. You can also decide if Superset should save computed values like SUM or COUNT and display them as separate items on a dashboard. This is useful flexibility that a good data visualization tool should offer. To know more about the roles played by Apache Superset among MLOps tools, model development, and its strengths as compared to other tools, please read the Apache Superset Review.
Recommended Reading: Learn more about Superset
Setting up Superset on your machine
While Superset can be used on a local machine, sharing the developed web page is easier when you work on the cloud. So firstly, please install Docker Engine and Docker Compose if not done already.
Superset can be sourced either from GitHub or the PyPi distribution.
- The download of the GitHub source code and subsequent installation can be done like this:
- git clone https://github.com/apache/superset.git
- cd superset
- docker-compose -f docker-compose-non-dev.yml up
- For the PyPi package, Superset can be installed using these steps:
- Dependencies can be installed by the command, sudo apt-get install build-essential libssl-dev libffi-dev python-dev python-pip libsasl2-dev libldap2-dev
- pip install --upgrade setuptools pip to upgrade pip and prevent any version-caused errors
- export FLASK_APP=superset
- pip install superset
- Now following common steps will create the admin user, upgrade the Superset database connection, optionally load some examples when Superset is launched, initialize default user roles and privileges, and start the Superset server on port 8088
- fabmanager create-admin --app superset
- superset db upgrade
- superset load_examples (Optional)
- superset init
- superset run -p 8088 --with-threads --reload –debugger
Once installed and running, you can open http://localhost:8088/superset to access the Superset client.
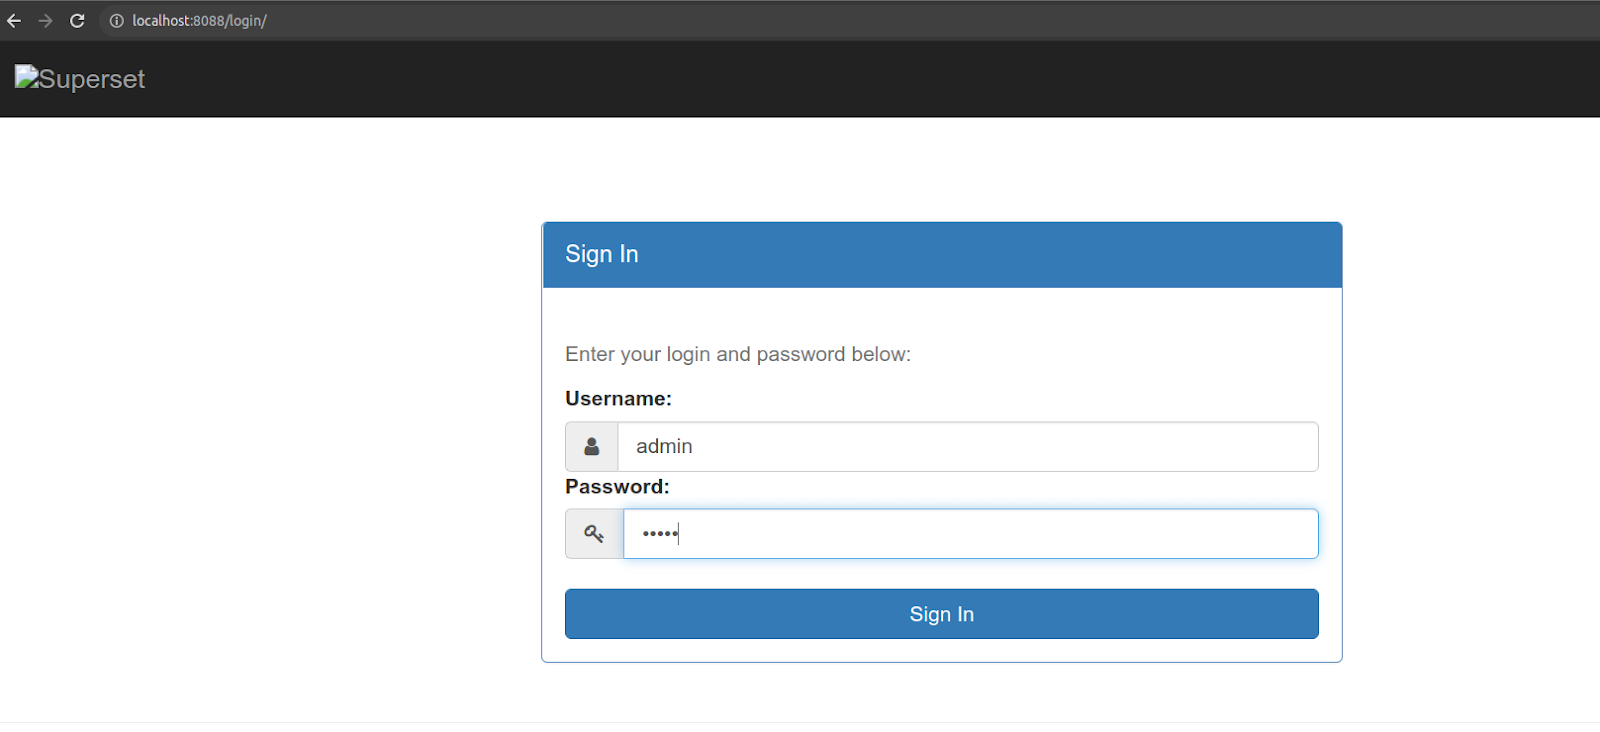
Common issues faced during the set-up
‘Just because something is not happening for you right now does not mean that will never happen’- An inspirational quote.
If you have encountered a web page that does not look like the above image, please read on.
- The login screen does not load or shows 'Error 500'
- The absence of the login screen means that the Superset server has not started. Please check the logs and command line. You might need to install required libraries like Flask.
- The welcome page is not displayed after logging in with the created username. This issue could happen because the Docker engine had not started, or Docker Compose is still building the requisite views for the first time.

It is suggested to wait for 5 minutes before refreshing the page, and if the error persists, then you may try troubleshooting through any of these steps:
- Please stop and restart the Docker engine by running docker-compose down –v followed by docker-compose up
- The default Superset port 8088 may be in use by another application. If the application is a hanging process, kill it and try again. Otherwise, please stop the superset run command and fire it with a different port number by using the flag -p.
Once you have logged in, the screen will look like this for the first time.
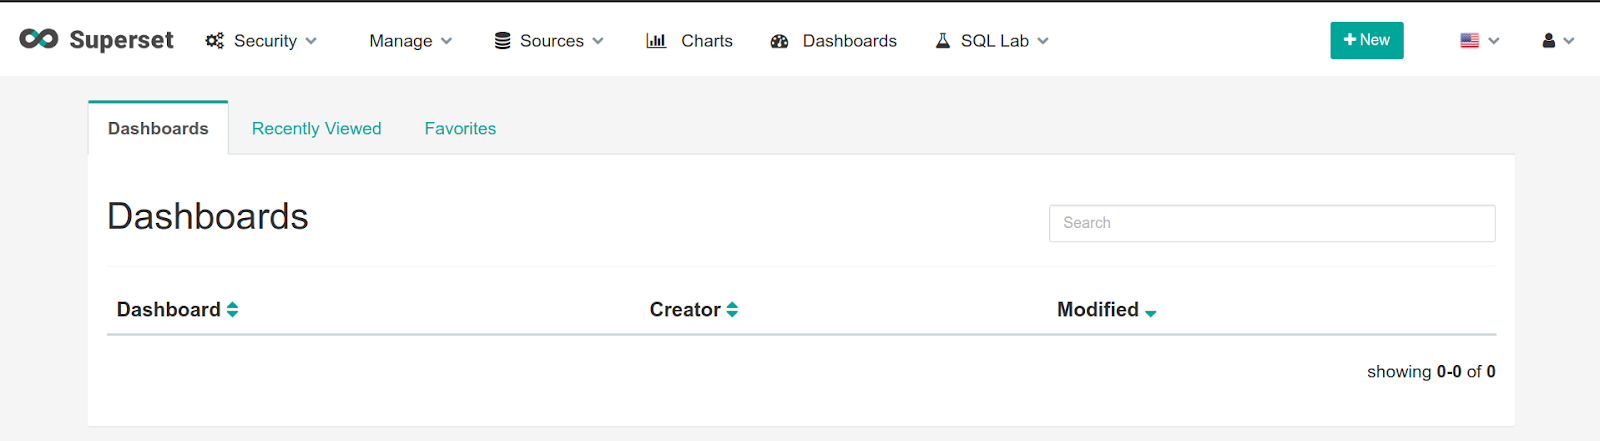
On clicking the Superset, you can view your profile and activities.
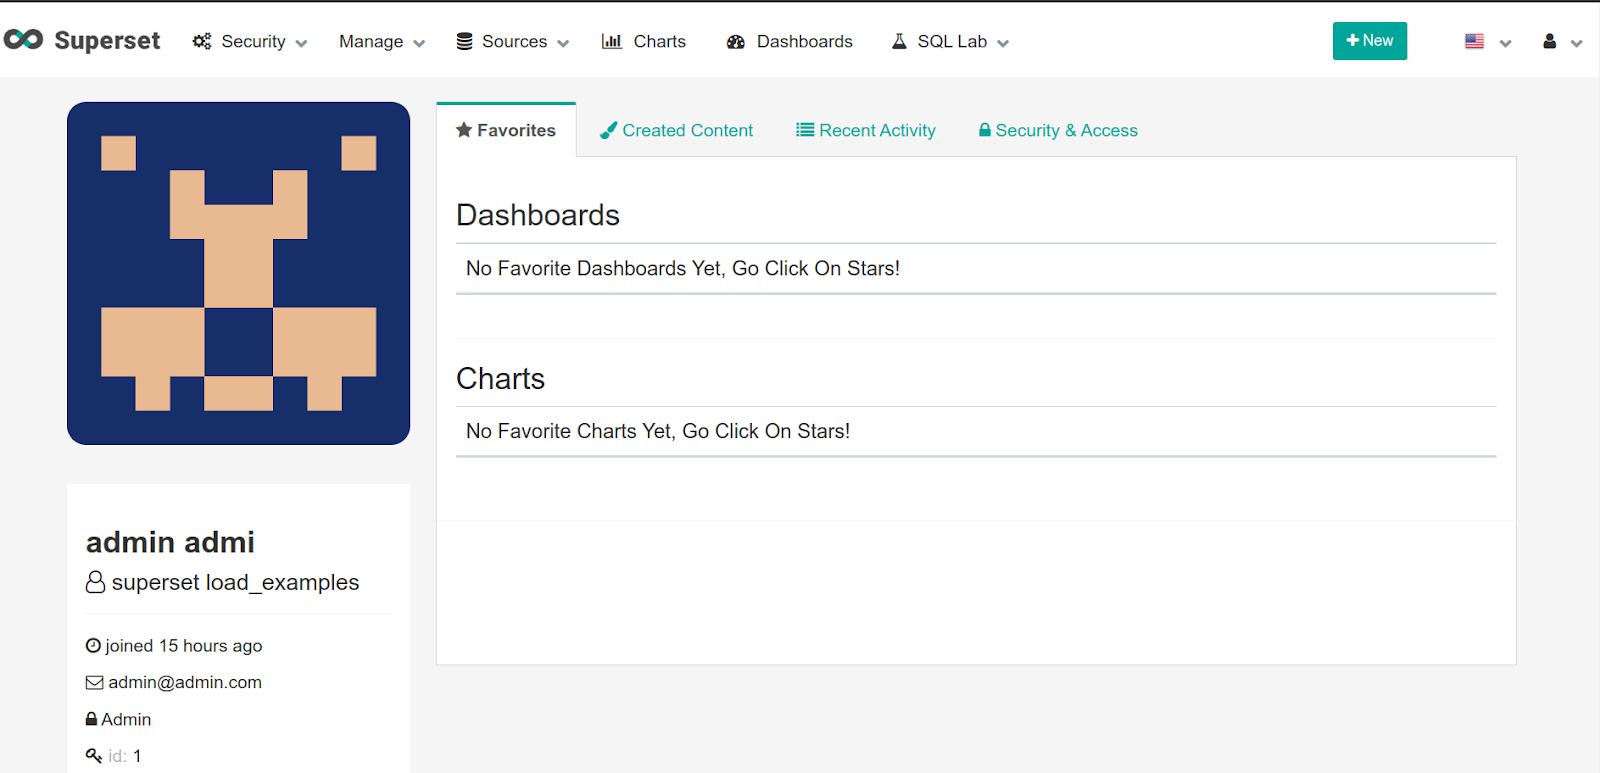
You can explore other options through the tabs like Security, Manage, Sources, Charts, Dashboards, and SQL Lab. Let us now go through each tab and get you familiar with data exploration on Superset.

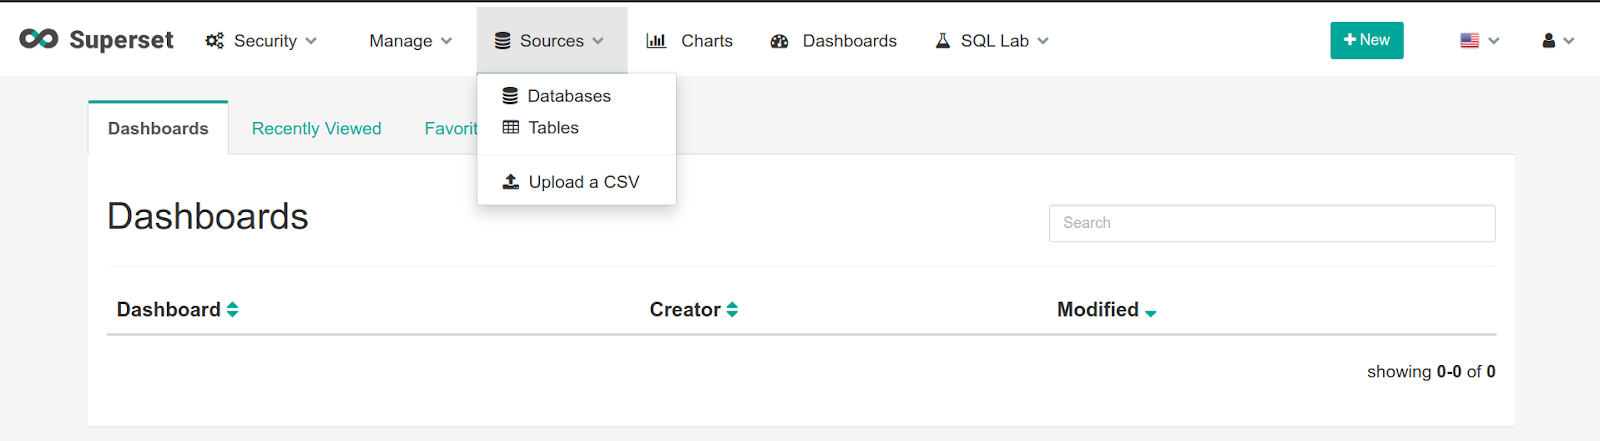
While the Security tab offers options to create and manage users and modify their permissions, the Sources tab lets you add databases and configure tables.
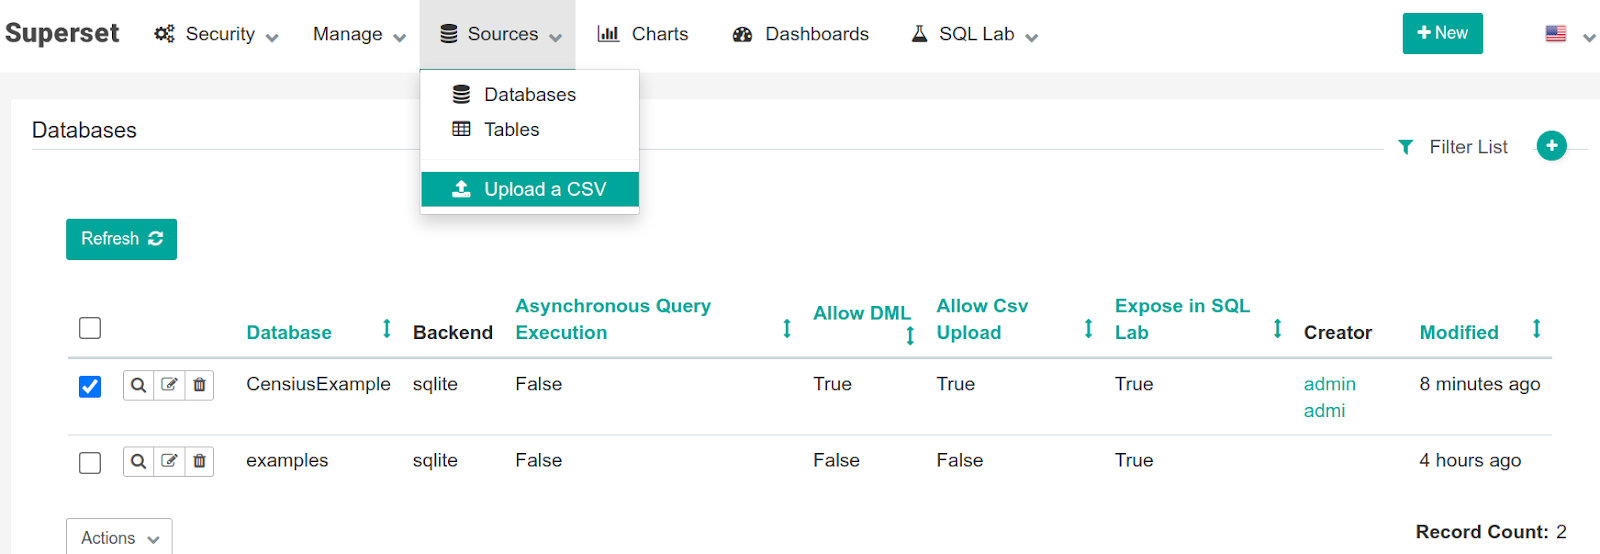
Database instances and Tables on Superset
We can see that Superset will let you access the databases and tables you have added or shared with. The third option would let you directly upload a CSV file.
Let us first make an example database to get started with data exploration. You can choose any database that can be interfaced with the SQLAlchemy connector, for example, MySQL, SQLite, PostgresSQL, Snowflake, MongoDB, and so on. You may also install SQLAlchemy connectors for other databases. For instance, if you wish to work with BigQuery, you need to install pybigquery package from PyPI distribution or cxoracle package to connect with an Oracle database.

You can give any unique name to the database instance to be added. The next field specifies the SQLAlchemy URI. By default, it is sqlite.////’path to superset db’. For the case of BigQuery, you will need to specify a URI of the form bigquery://. The connection can be tested to check if the correct URI has been added. If the connection is fine, a 'Seems OK' pop-up message will be displayed; otherwise, an error log would give you more information.
Further options let you customize database access. The added database instances can be viewed, edited, and deleted from the Databases section. Also, you can add a new record through the addition button.
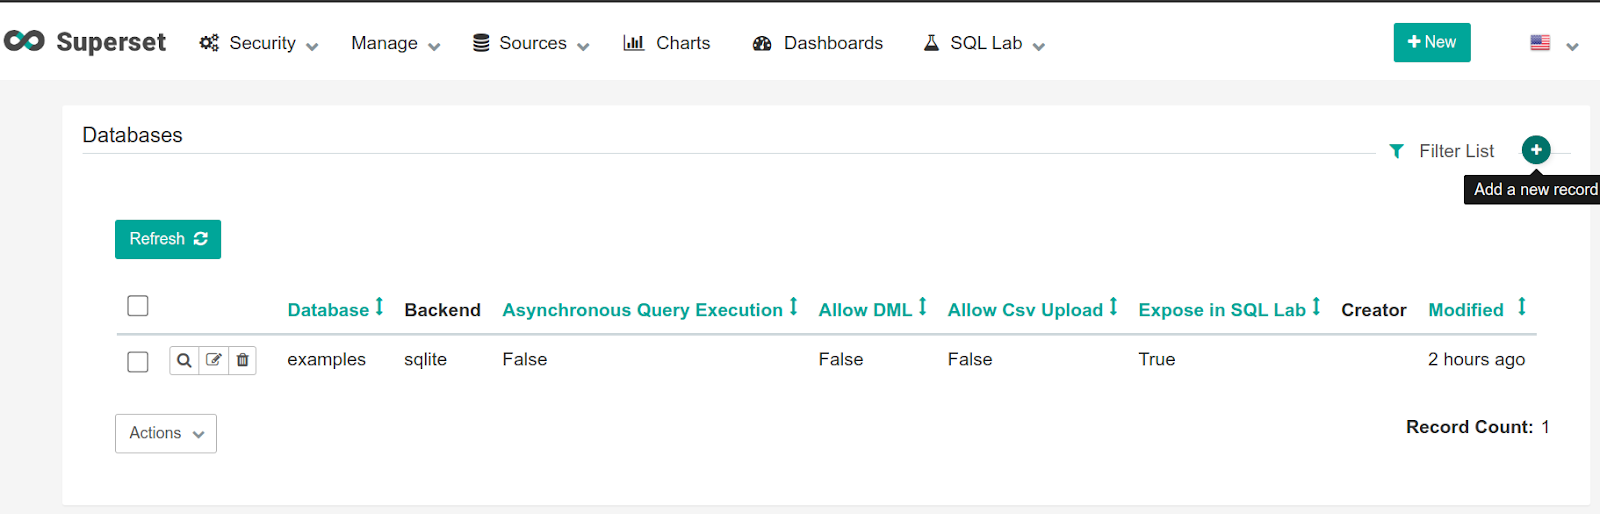
An added database instance can be modified later through the edit option, which will result in such a view:

Data exploration on Superset
Now let us explore a time series and see how running queries and plotting charts is easy with Superset. For this Apache Superset tutorial, we made an instance of SQLite database and named it CensiusExample.
To this database, we will upload a CSV file containing household electric power consumption measured in Sceaux, a city in France. The upload of this file to Superset also offers additional options.
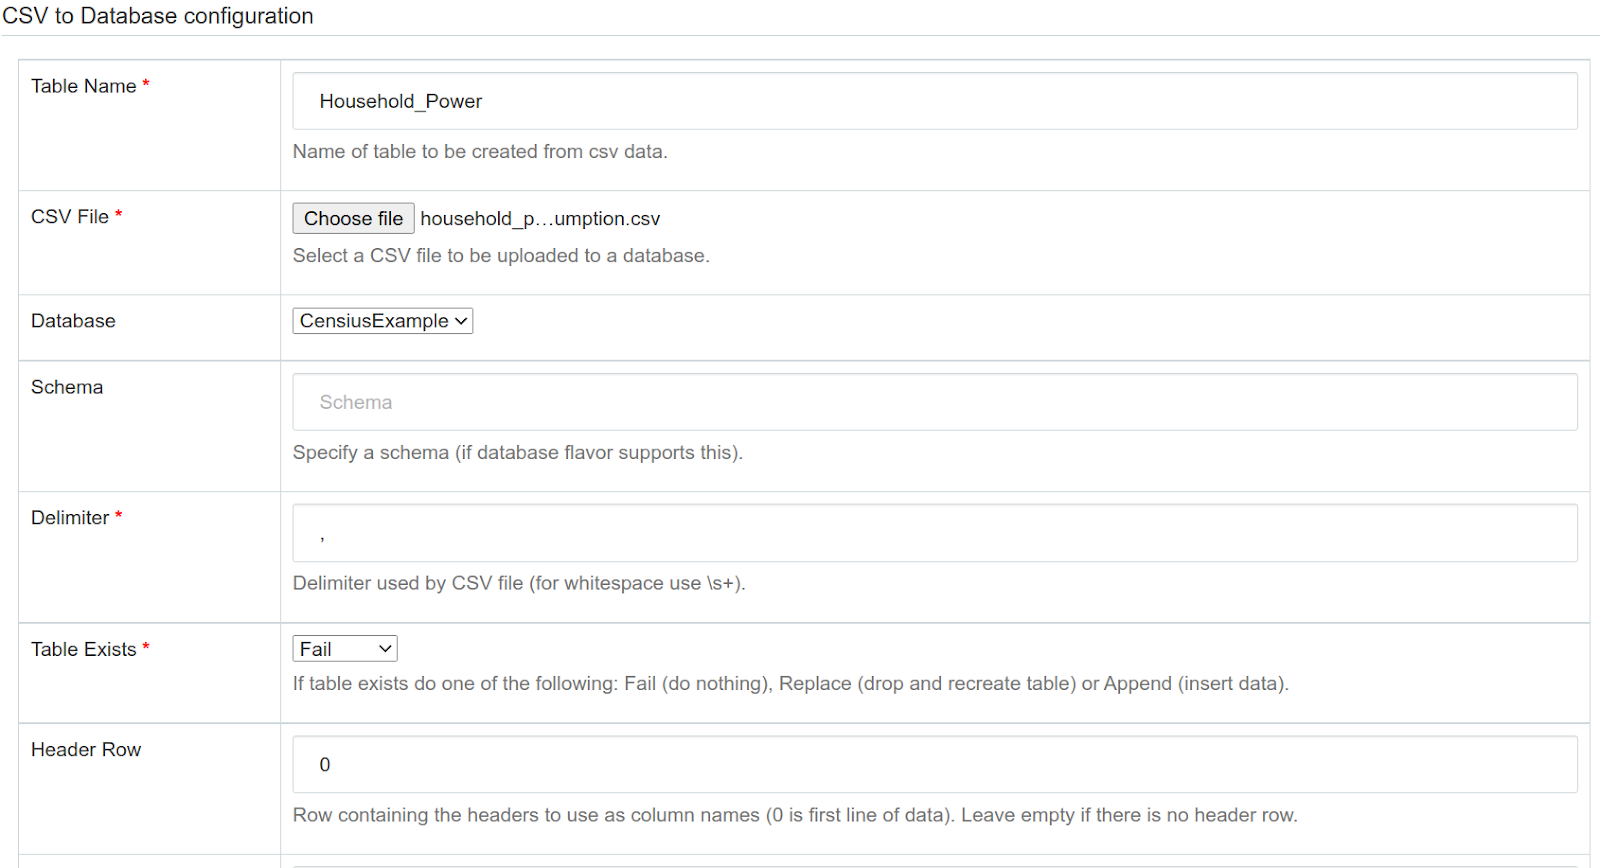
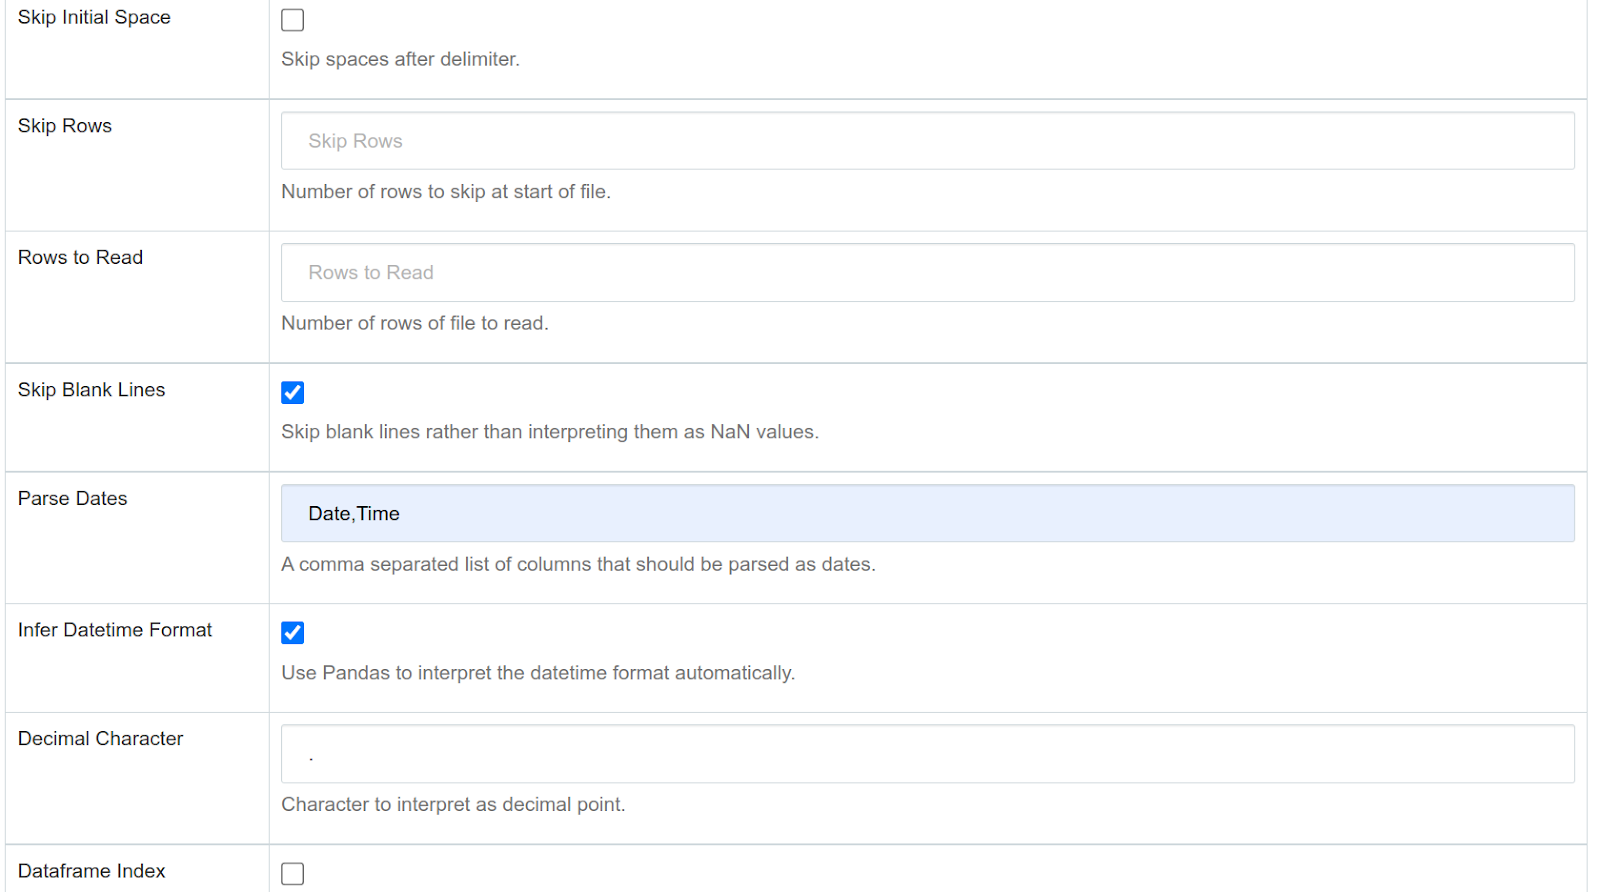
The upload form offers customization options to specify other delimiters, skipping particular rows and columns, and so on. Since the dataset is a time series, you should also specify the Date and Time fields to be parsed as the date and enable the inference of the datetime format.
SQL queries and result visualization
The uploaded file can now be explored and queried in the SQL Editor under the SQL Lab section. The selected database and table will look like this in the editor:
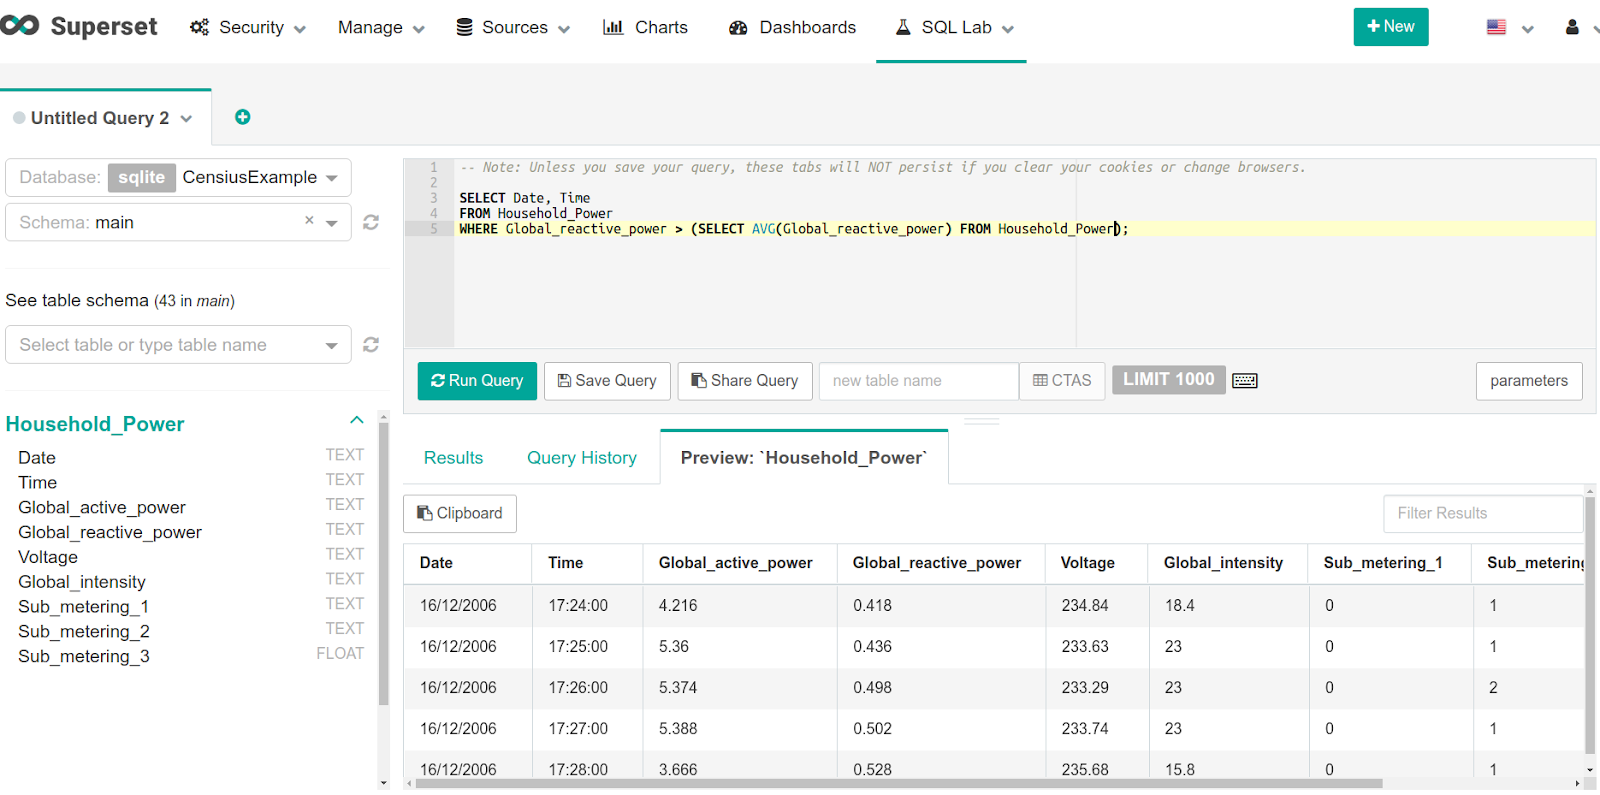
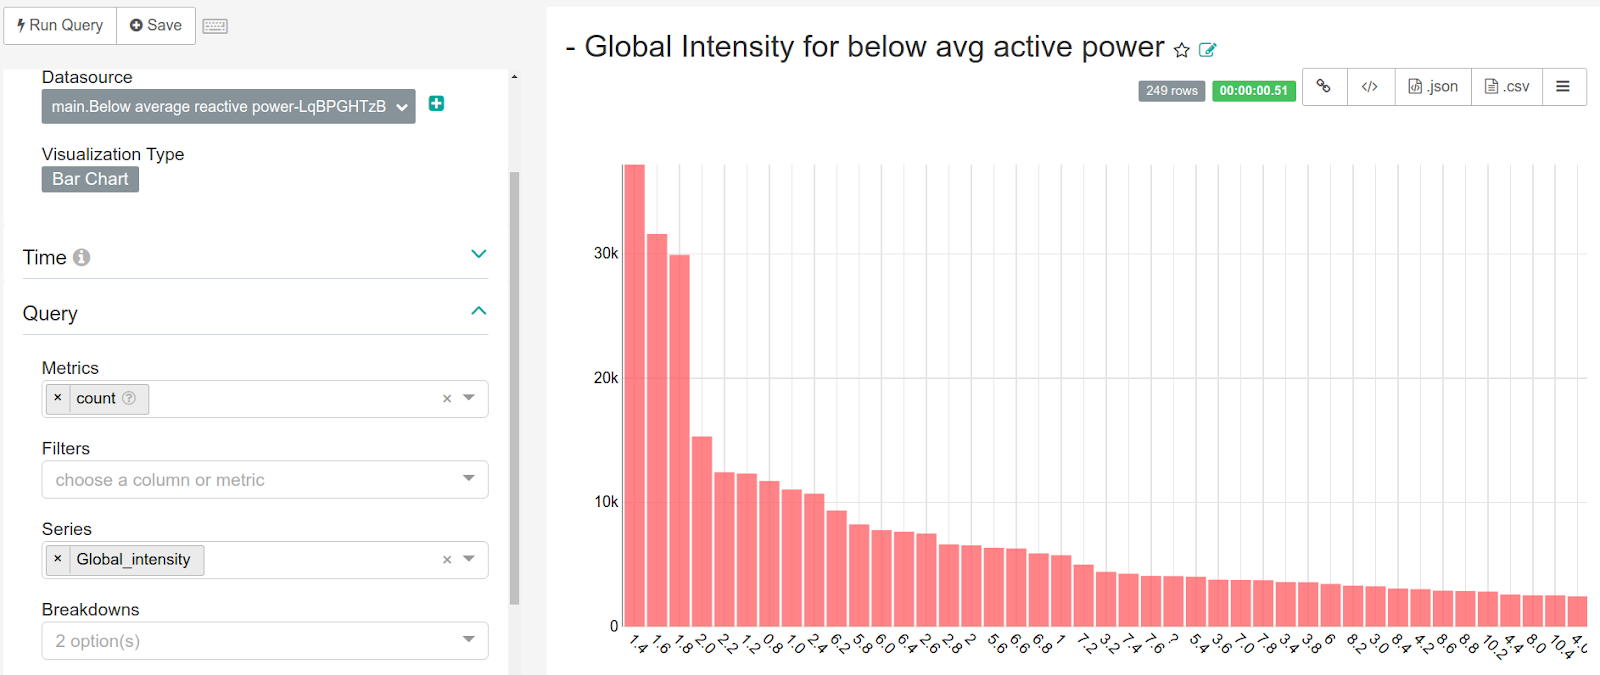
Let us run a small query to shortlist global intensity, i.e., the minute-averaged current intensity in amperes, for the households that consumed minute-averaged active power below the average value.
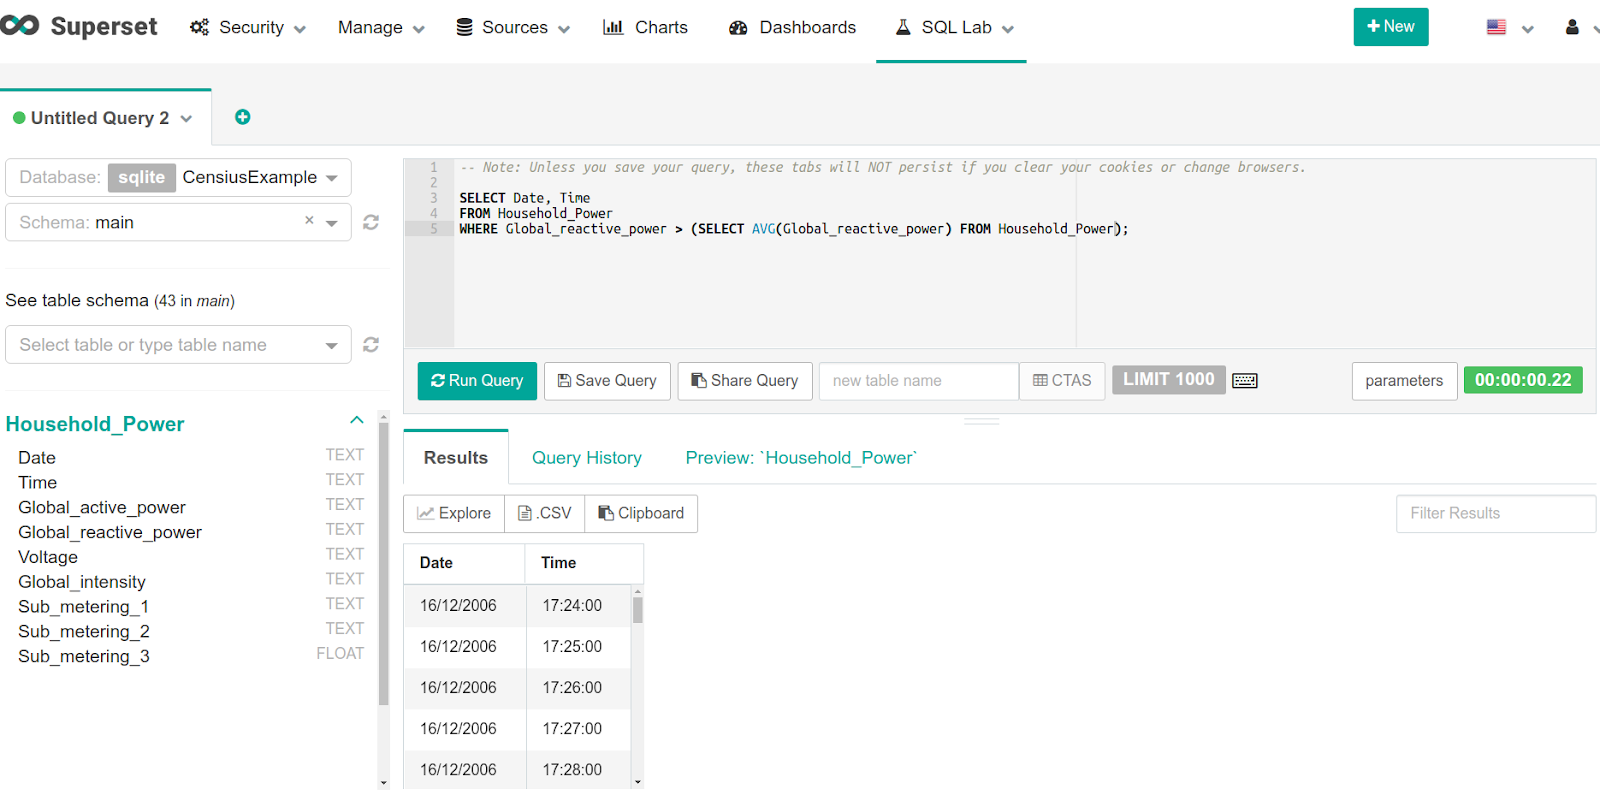
The query results can be exported to a new CSV file or copied to the clipboard. You have the numbers, but plots give a better meaning to them. We can visualize the same through the Explore option.

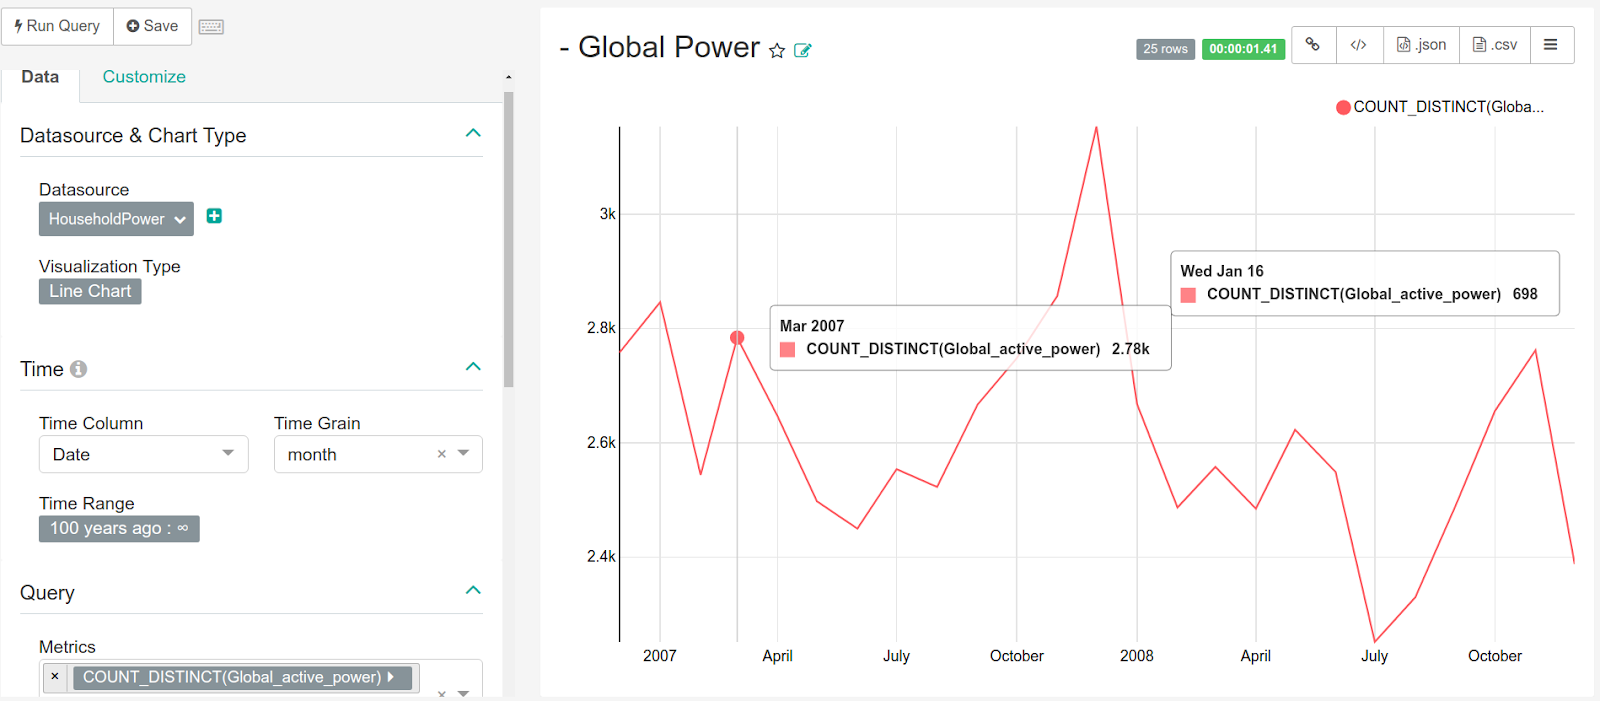
The visualization page will look like this:
You can also change the plot style to view different representations. For instance, let us visualize the above results as bar charts or trend lines.
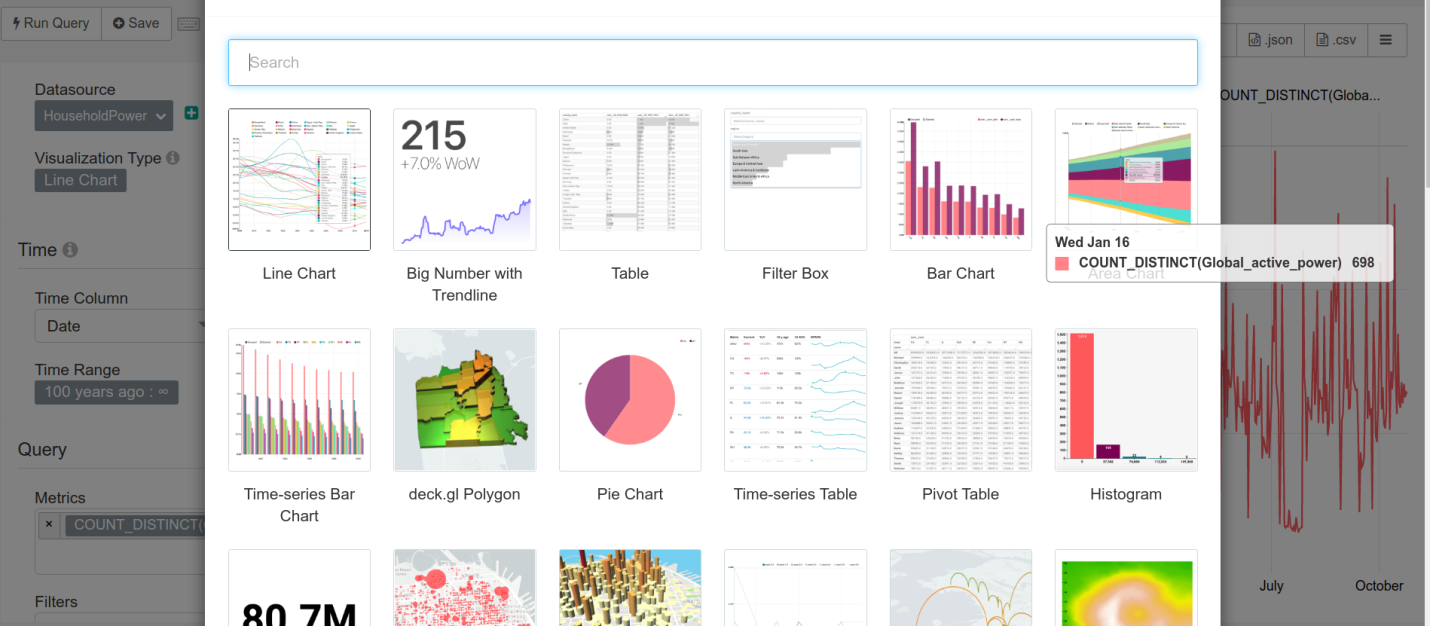
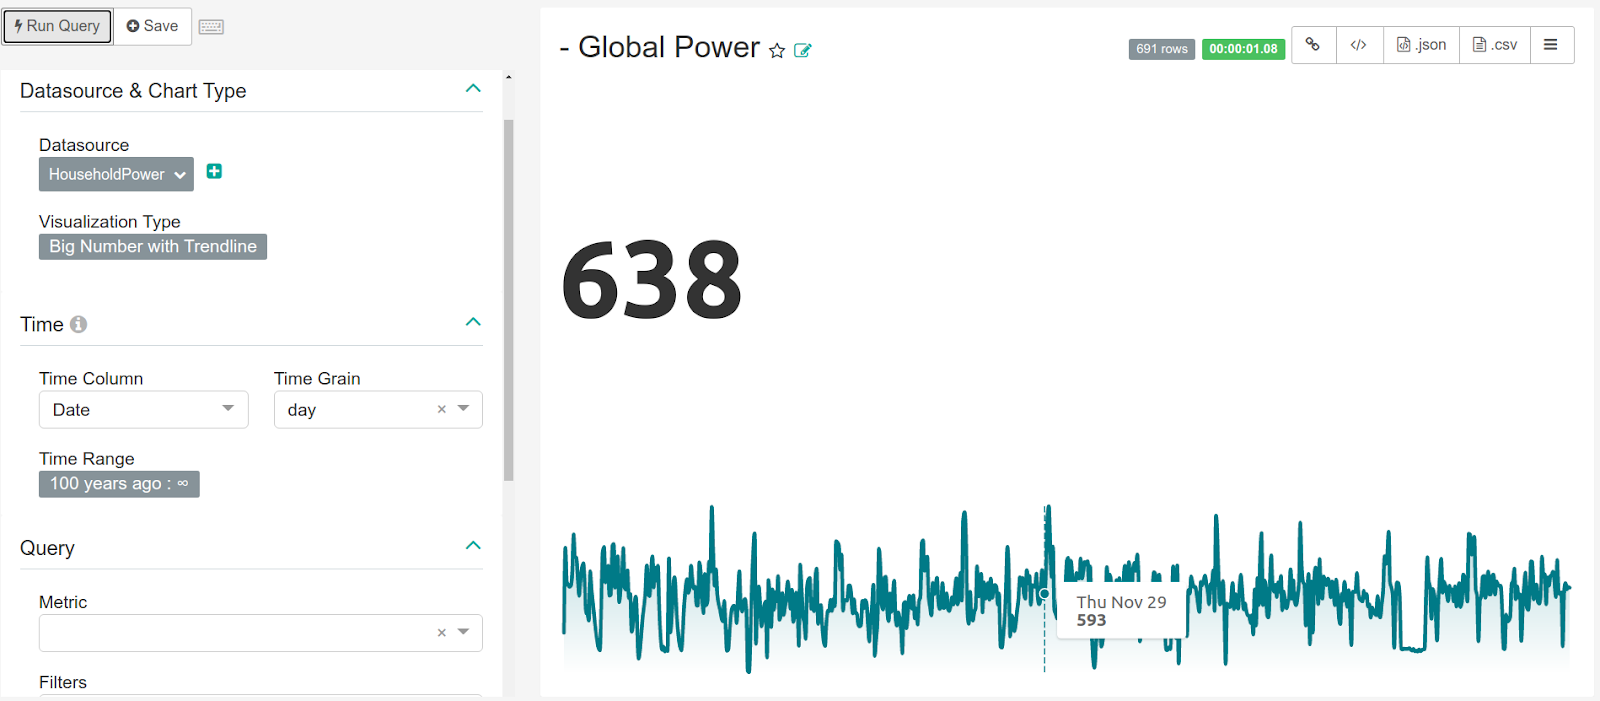
Additionally, you can modify the time granularity and other filters to get more informative charts.
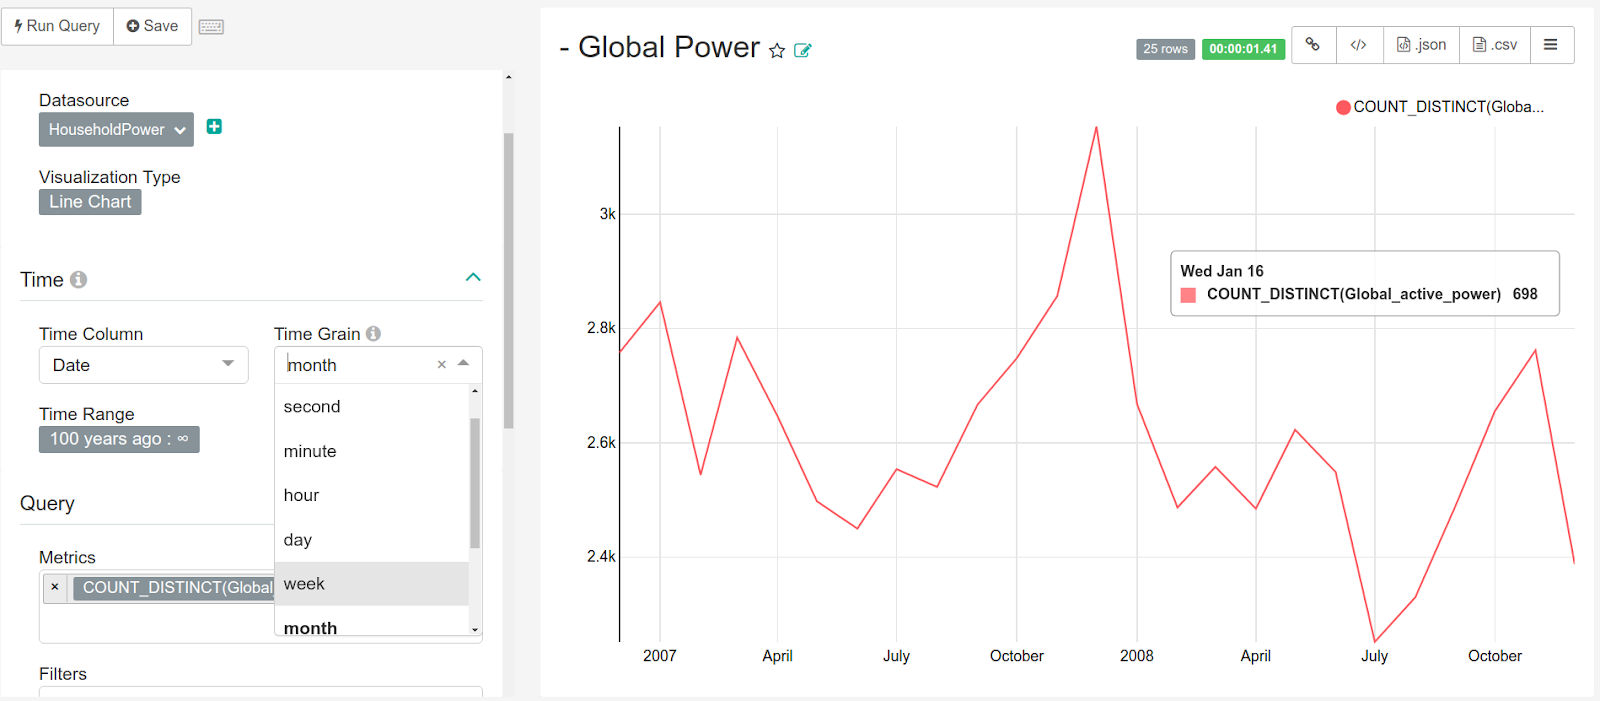
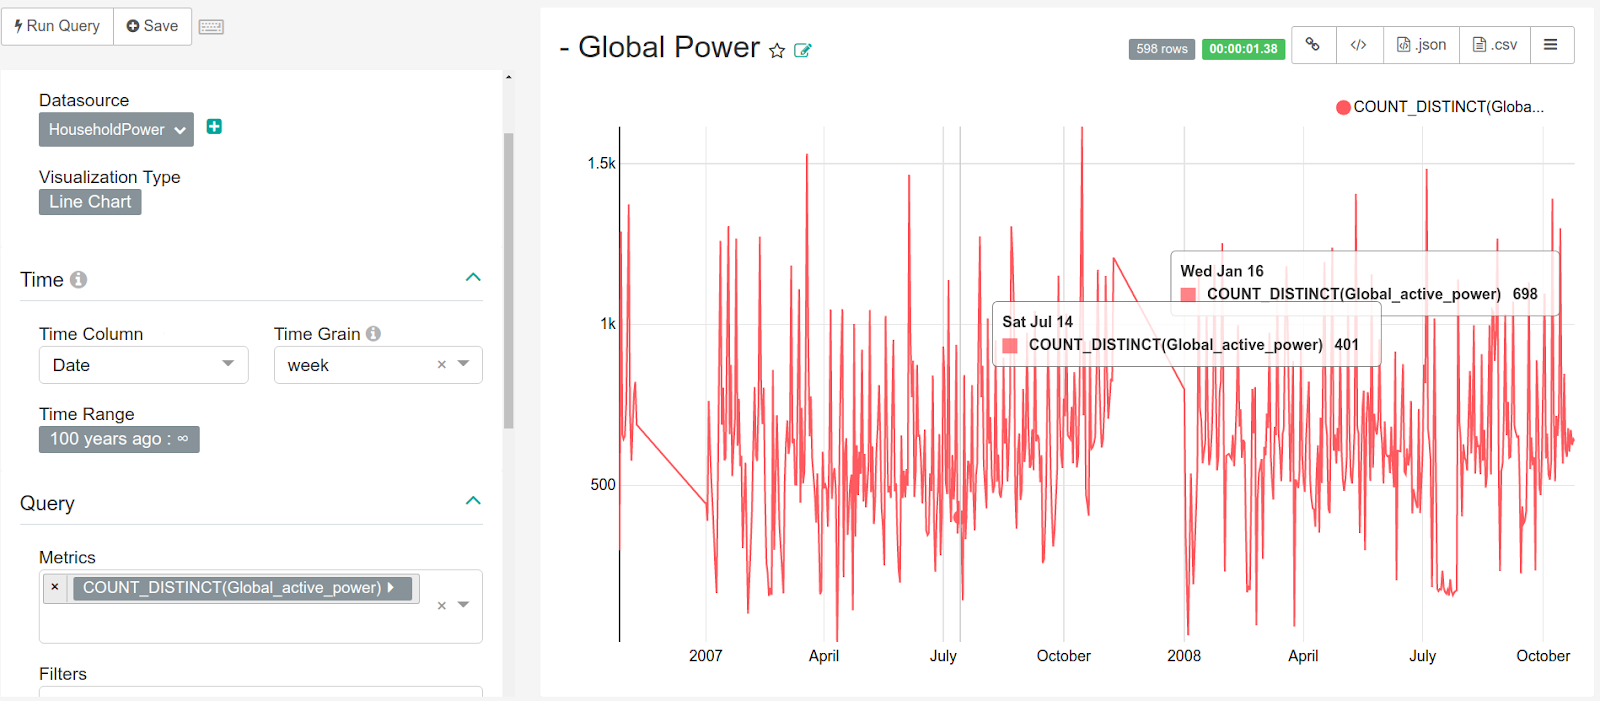
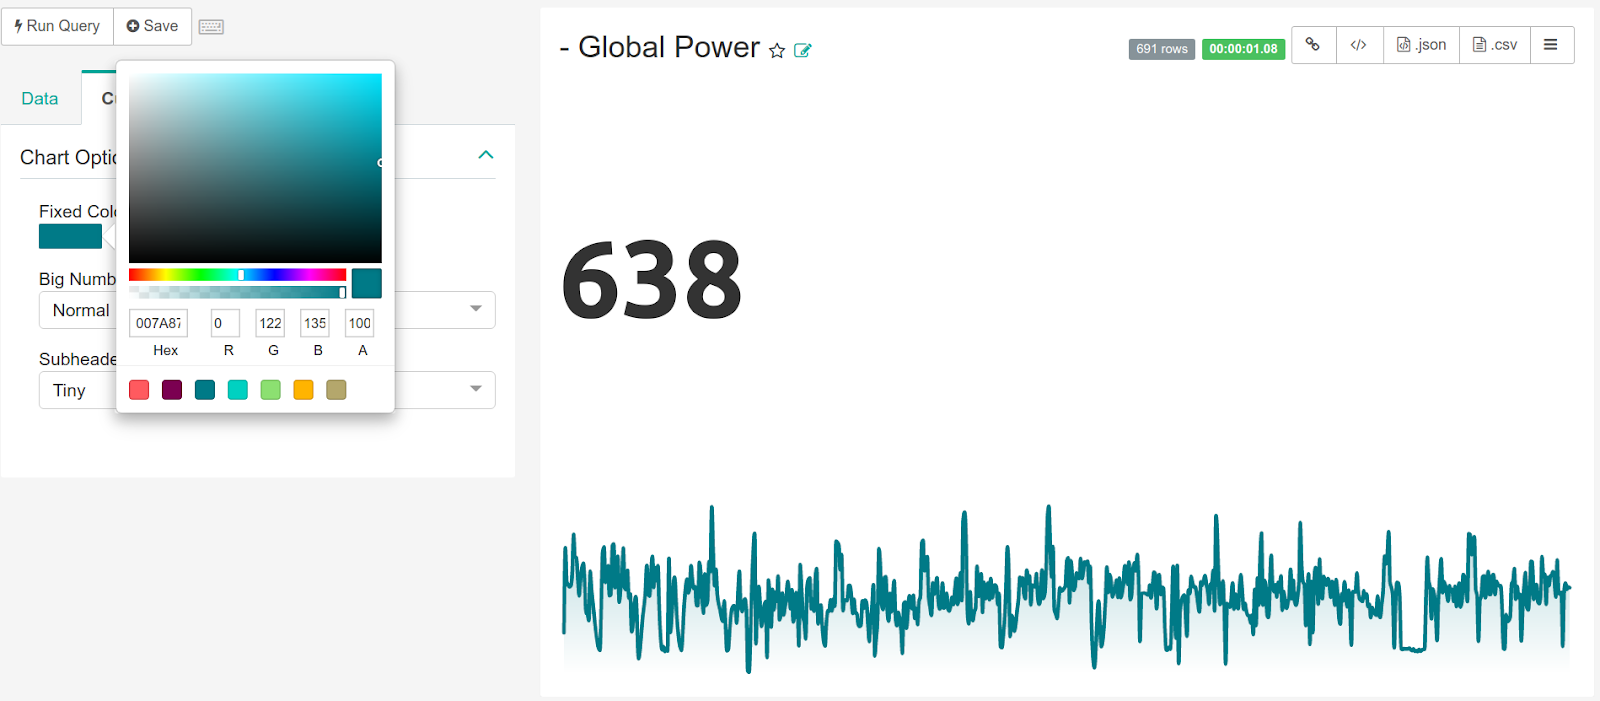
What’s more? You can change the look and feel of the plots to suit your preference.
Building your first Superset dashboard
The biggest advantage offered by Apache Superset is the ease of building dashboards. Let us build a Superset example dashboard for power consumption measurements from houses in Sceaux. A newly created dashboard will look like this:

There are two methods of adding charts to a Superset dashboard. The first is to import an already constructed chart as we did for the query run in SQL Editor. Please open the specific chart and save it as a part of the dashboard to import it.
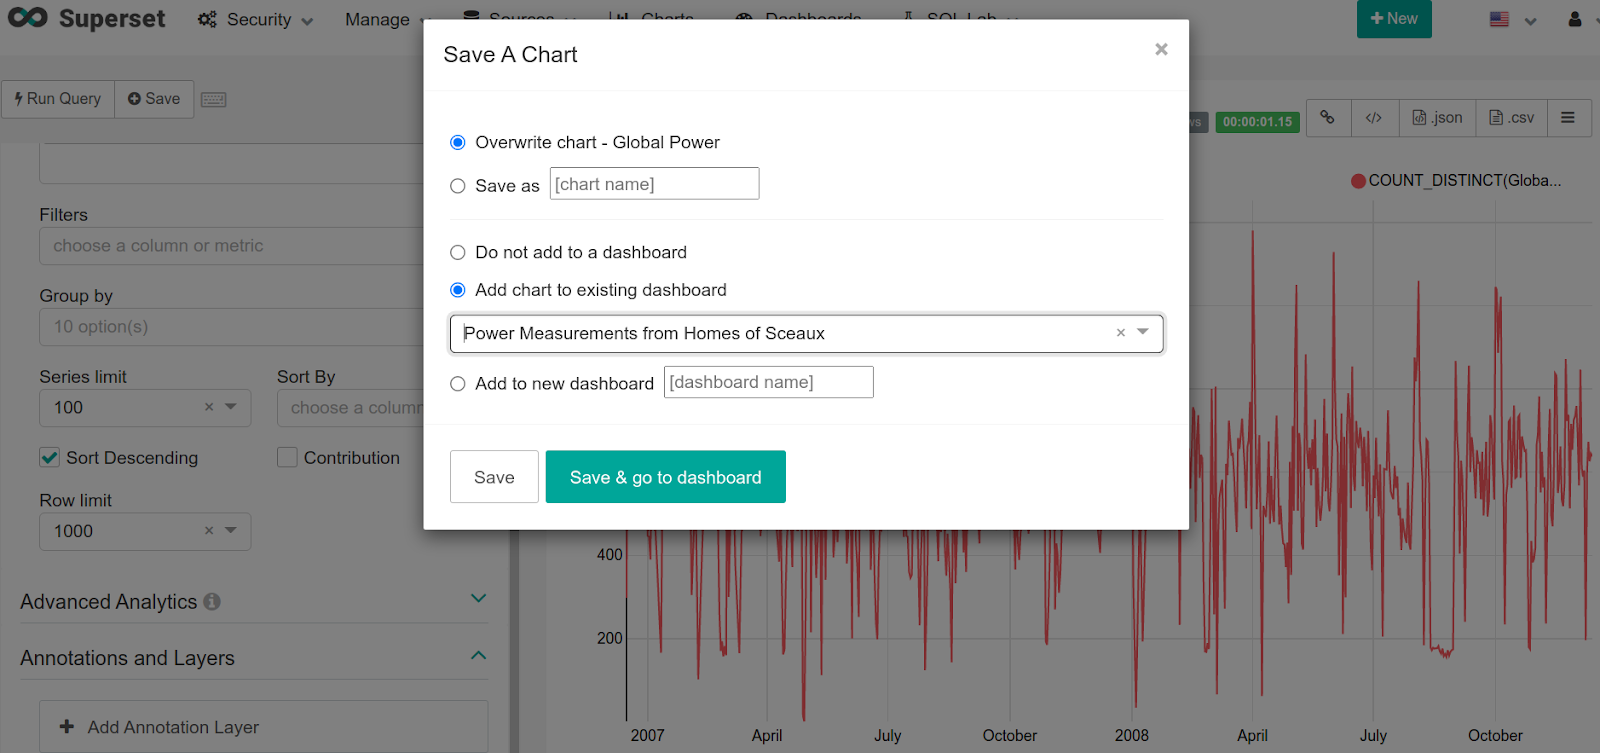
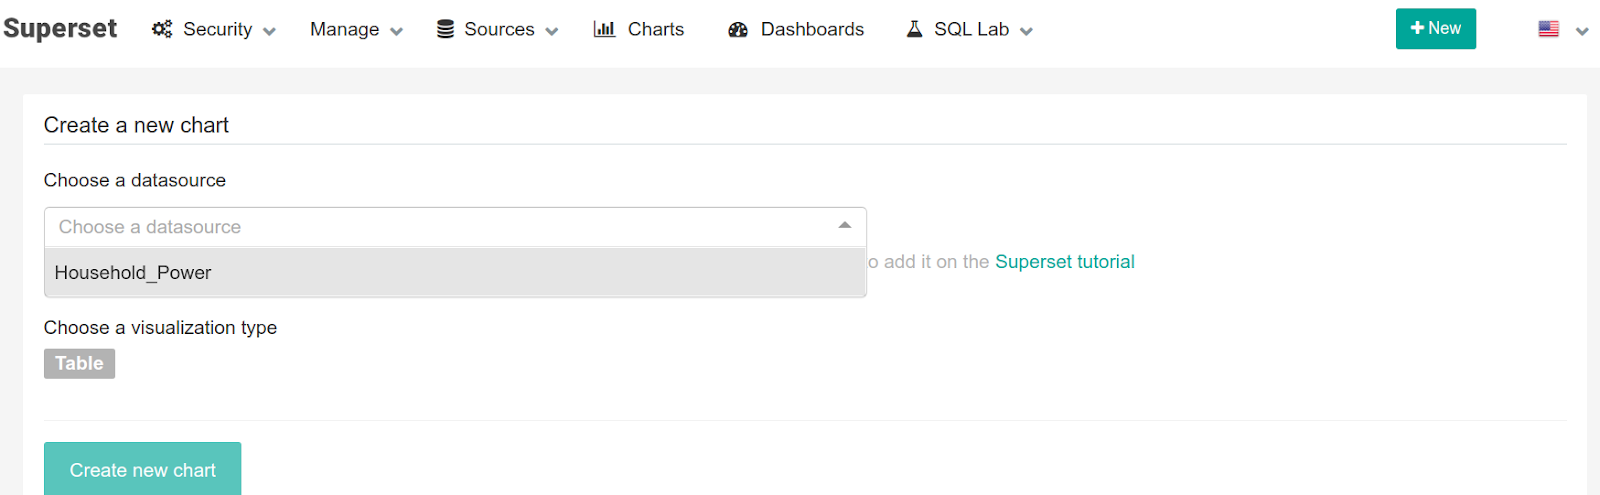
Another way of adding a chart to the dashboard is to create a new one in the Charts section.

The newly created chart can be added to the dashboard by the save option as in the first case.
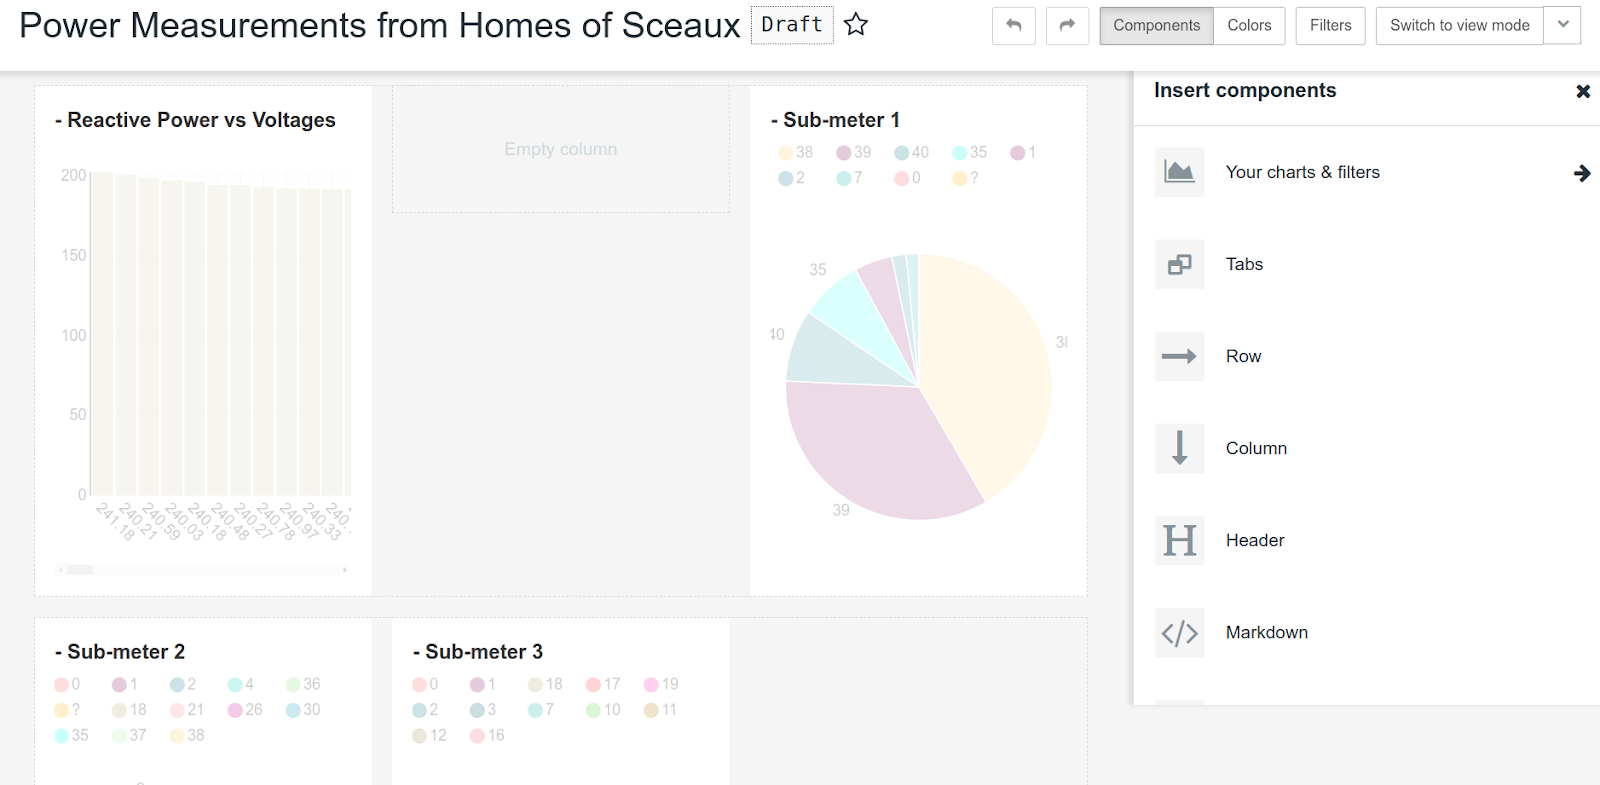
Editing the dashboard
We have made a dashboard that shows the trends and some pie charts.
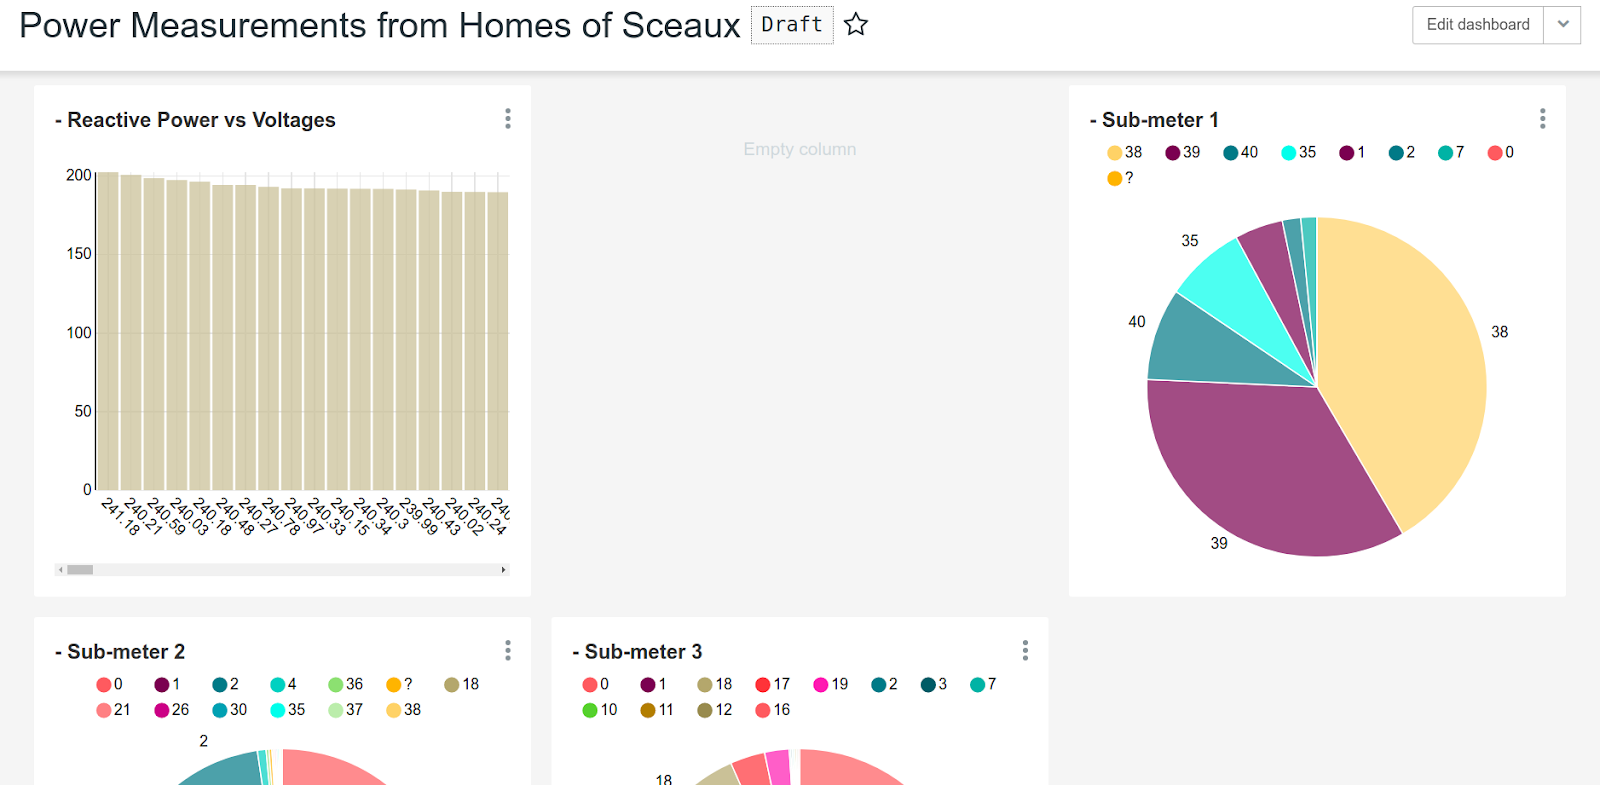
It is clear that the dashboard requires re-organization and can be simply done by selecting the Edit Dashboard option above the charts display area. The component charts can be moved around through drag and drop to reduce the clutter and create a better-looking board.

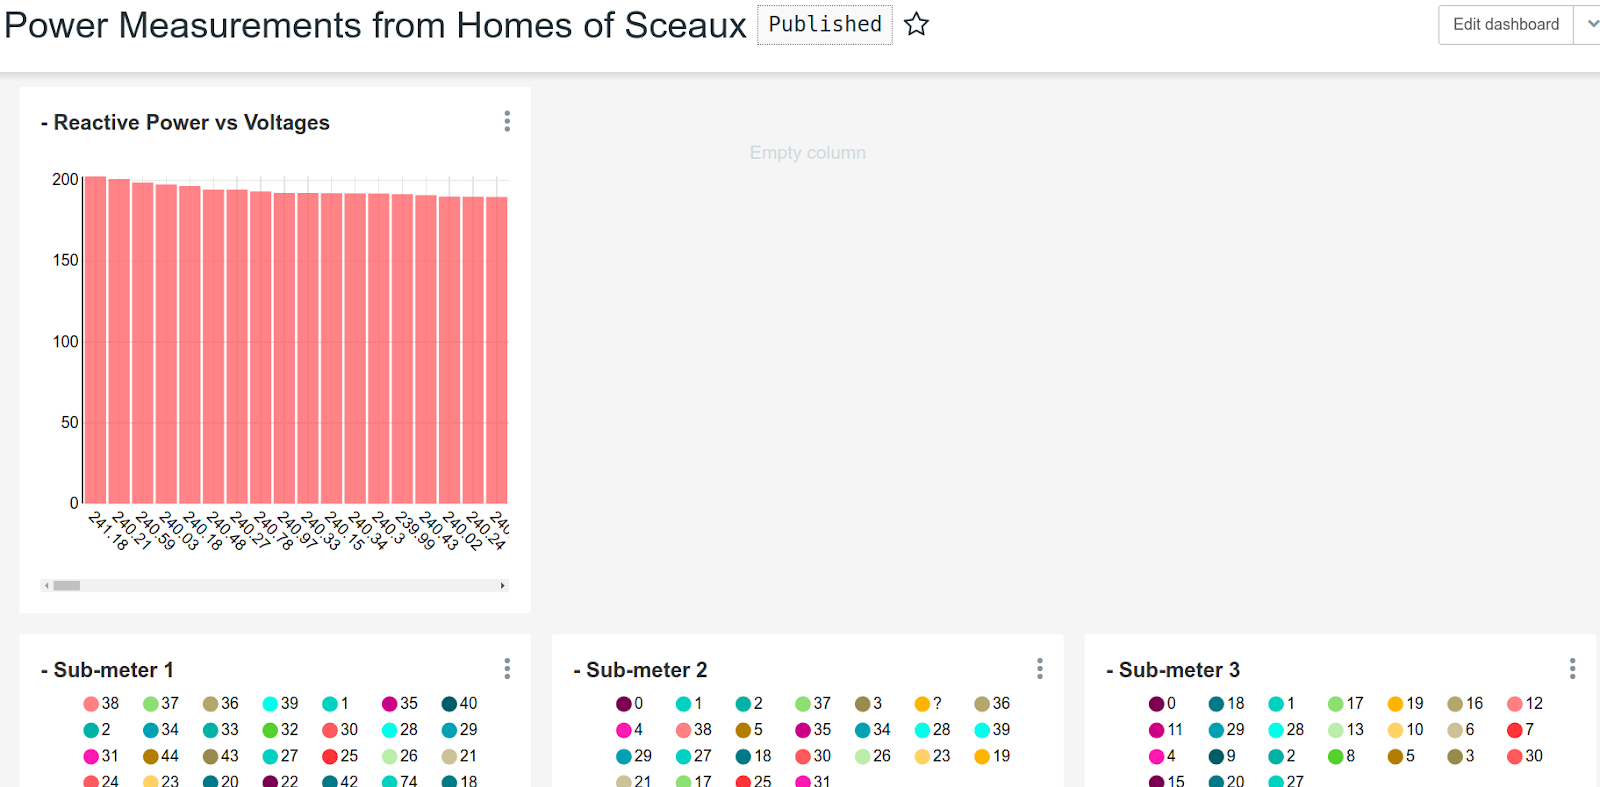
Save the changes to get a dashboard that looks like this:

Your dashboard for power consumption measurements of houses in Sceaux is ready, but your team still cannot view it. To do so, please publish the dashboard. Please check the status displayed beside the dashboard name to check if the dashboard has been published.
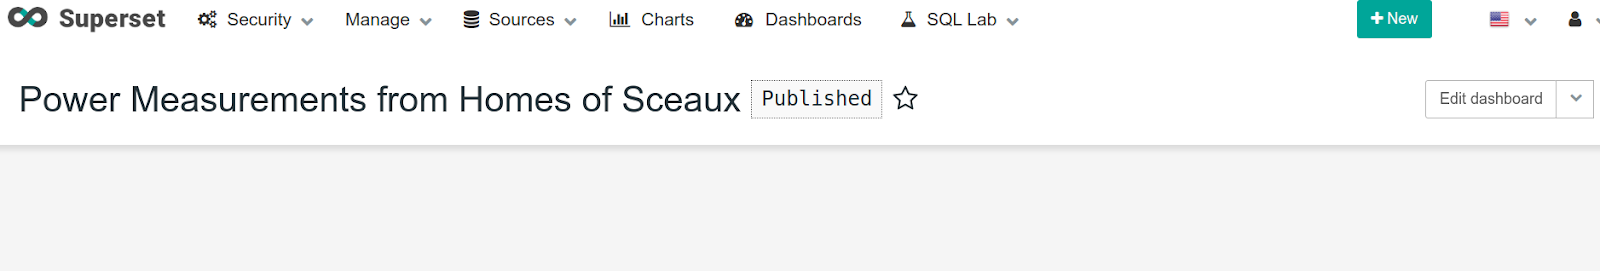
The example dashboard is now ready to be viewed by the team.
Thank you for reading. We look forward to seeing some beautiful visualizations and dashboards that you would create from the takeaways of this Apache Superset tutorial.
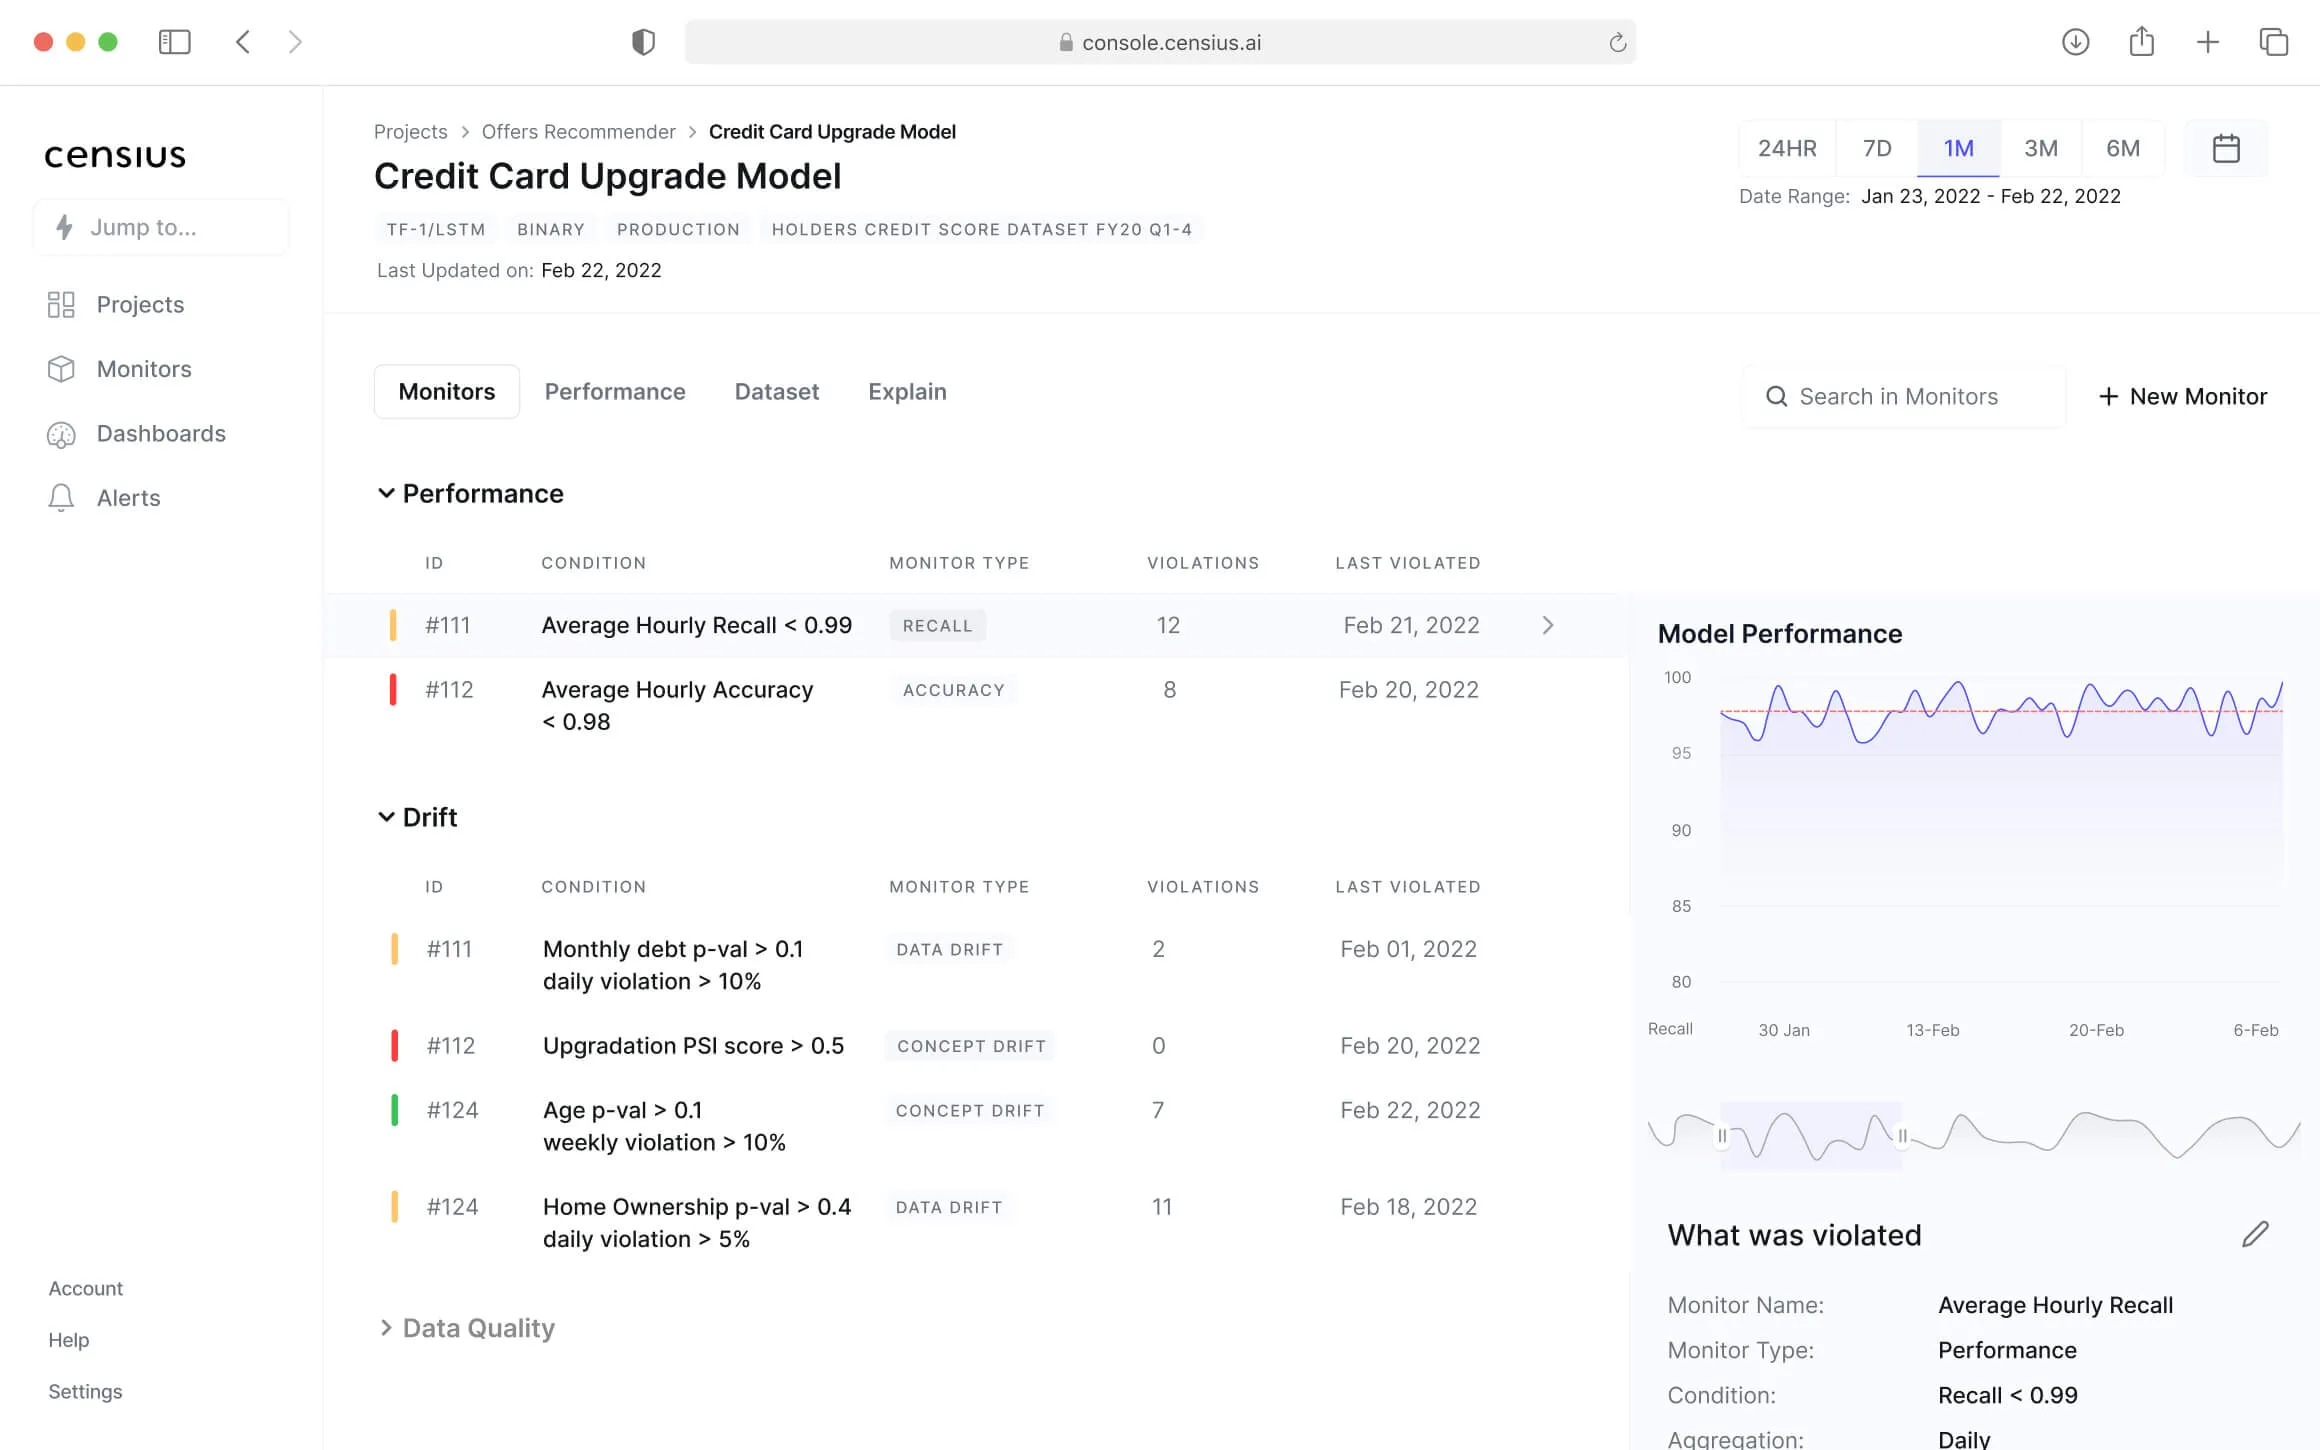
PS: Speaking of visualization, are you ready to take your model visualization to another level? Start exploring the power of visualization with Censius AI! Try it out for yourself and see how easy it is to build beautiful, interactive dashboards that provide actionable insights.
Sign up for a free trial today and start creating your own custom visualizations in minutes.
Explore how Censius helps you monitor, analyze and explain your ML models
Explore Platform