
The adoption of Artificial Intelligence (AI) in different operations has become widespread. According to global AI adoption trends & forecast by Cognylitica, an astounding 90% of respondents believed that AI implementation will be part of their projects by 2025. The power of AI has been harnessed well in crucial domains like healthcare and finance. In another study on financial industry AI solutions, 97.6% of book-keepers believed that AI would automate their work. Additionally, 73% of executives trust AI to improve their company’s finances.
The year 2020 saw 726 billion digital payments across the globe, where 25% of these transactions were reviewed manually. AI, therefore, holds great application potential. Its real-world use cases include
- Chatbots
- Personalized calculation of creditworthiness
- Fraud detection
- Assisting consumers in lowering their loans or debts
- Facial or voice recognition for biometric authentication
- Peer to peer payments among digital wallets
Since AI has permeated different functions in the finance industry, there is a greater need to ensure trust in its implementation. Unlike conventional software, AI/ML models are black-boxes to most stakeholders. The lack of transparency is aggravated by the choice of algorithms gravitating toward deep learning to cater to a demanding environment.
The use of ML for transaction monitoring is an example of the need for transparency. For a bank that previously worked on rule-based monitoring, the addition of ML reduced noise in the data collected from the live environment. Thus helping in lowering false positives. Additionally, an unsupervised anomaly detection model can flag activities suspected of money laundering.
The output of such a model would help transaction monitors recognise risky transactions. However, such models must be guarded against unintended bias that may be introduced through the collected data. The analysts would gain insights into model reasoning in case of a false positive for a fraudulent transaction.
What is Model Explainability?
Model explainability comprises Explainable AI (XAI) and its counterpart Interpretable Machine Learning (IML). These two are algorithm families that aim to present explanations behind predictions made by AI/ML models. XAI has become the solution to make models less opaque to ensure accountability.
XAI operates on two granularities:
- Global explanations: Interpretations achieved at this granularity seek to explain the model behavior in the purview of the features.
- Local explanations: Interpretations at local granularity focus on data instances to explain the influence of features.
We have already written an article to help you gain a better understanding of what is model explainability? And why is it so important?
Explainable AI in Finance
There are many more use cases for Explainable AI in the finance domain that include credit score calculation for loan applications or default risk in mortgage-backed securities. The different stakeholders have the following expectations from XAI
- The causes underlying a particular outcome
- The data and features used to reach the outcome
- The training and testing data used on the model
- The guidelines and compliance governing the design and implementation of the AI system
- What parameters of the feedback were processed
- How were the explainer models trained
How does XAI help Evaluate Financial Models?
To better understand how Explainable AI in credit risk management helps to achieve the above objectives, let us pit two commonly used models against each other. Their duel will be measured in terms of served explanations and decide the winner.
Introducing the two opponents: We have a logit model based on linear logistic regression on the one hand. On the other, we have a Gradient Tree Boosting model (GTB), which is notorious for functional opacity. The two models were trained and tested on mortgage data and aimed to predict the performance of subsequent cohorts.
Round 1: Local explanations for features that governed the predictions
Local explanations reveal the influence of each feature's influence on the default probability of a loan application.
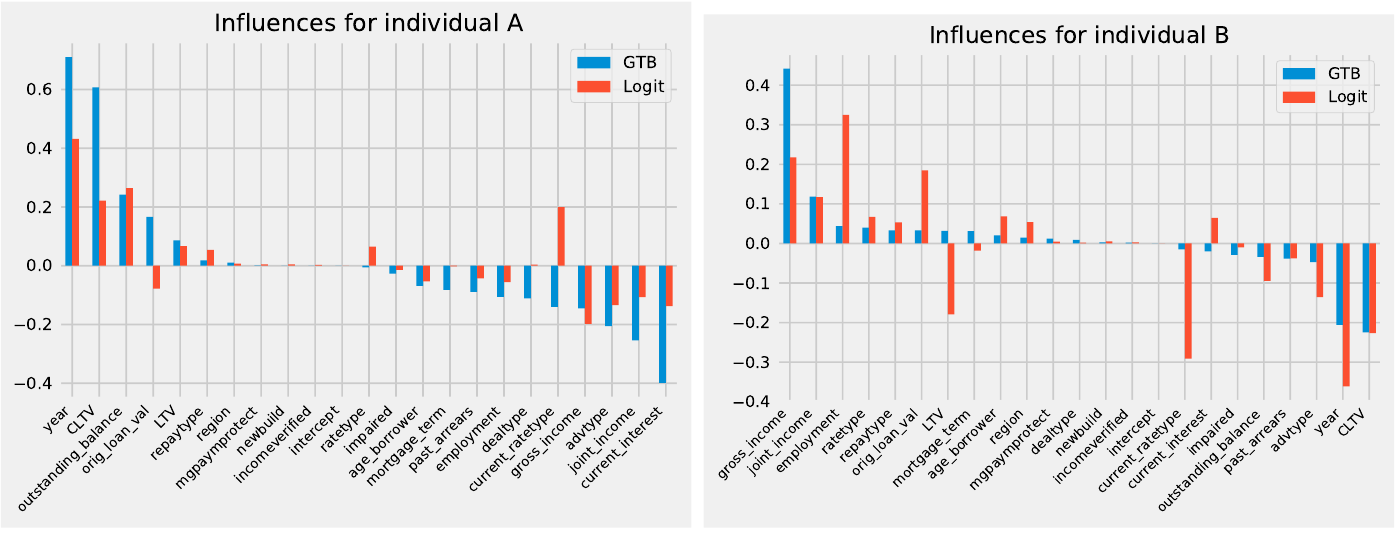
The two individuals, A and B, had different characteristics. While A earned more than B and their mortgage was also older, individual B had a low Loan-to-Value ratio (LTV). Therefore, the default probability for B was also low. As seen in the image, both Logit and GTB models assigned similar significance to the features with slight variations, for example, the current rate type of the mortgage.
Round 2: Global explanations that drove the model learning
In the previous round, feature attribution was calculated at individuals' finer level. Global explanations, on the other hand, gauge the overall characterization of the models.
As seen from the plots of local interpretations, the feature ‘year’ was considered influential by both models. Global explanations can help your team determine if the features are significant in real-life or not. Here is how:
The training data and assumptions by data scientists could become redundant in the light of new live environment dynamics. For instance, data collected when underwriting standards were lenient could lead to the assumption that older mortgages would default after the end of the initial incentive period. This may not be the case with new data collected post-deployment for model re-training.
Therefore, while the feature ‘year’ may seem a sensible choice initially, its rationale may not hold universally or over the long term. Global explanations can help the teams analyze such surprising elements.
Round 3: Explanations in terms of scores
Explanations can also be generated to compare performances of linear and non-linear models. A third player, a linear model, can be used as a benchmark to gauge the influence of a particular feature. Apart from comparing models using individual or model level explanations, unary and Shapley values may also be compared to differentiate the prediction rationale.
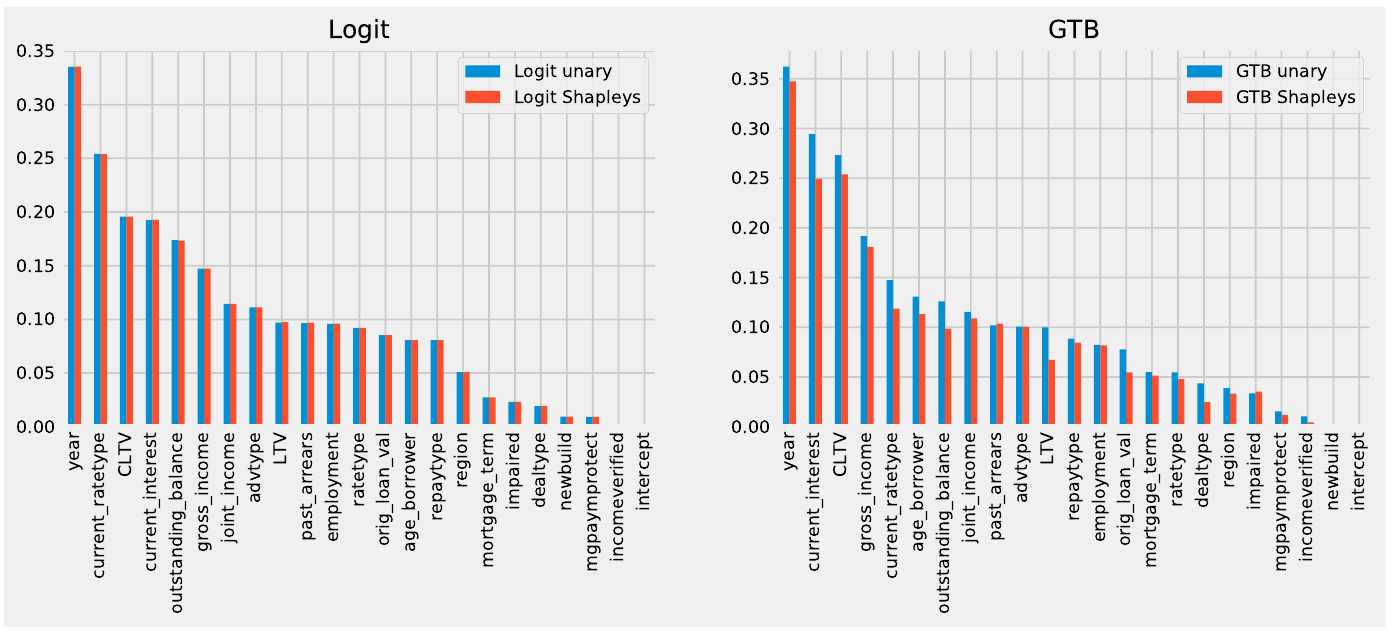
Let us focus on the feature ‘current_ratetype’ for the mortgages which captures if the mortgage rate was fixed or variable. The above image, the comparison of unary and Shapley values and shows that the Shapley method caught feature interactions better for the GTB model.
On the other hand, the difference between the two values is negligible for the linear Logit model.
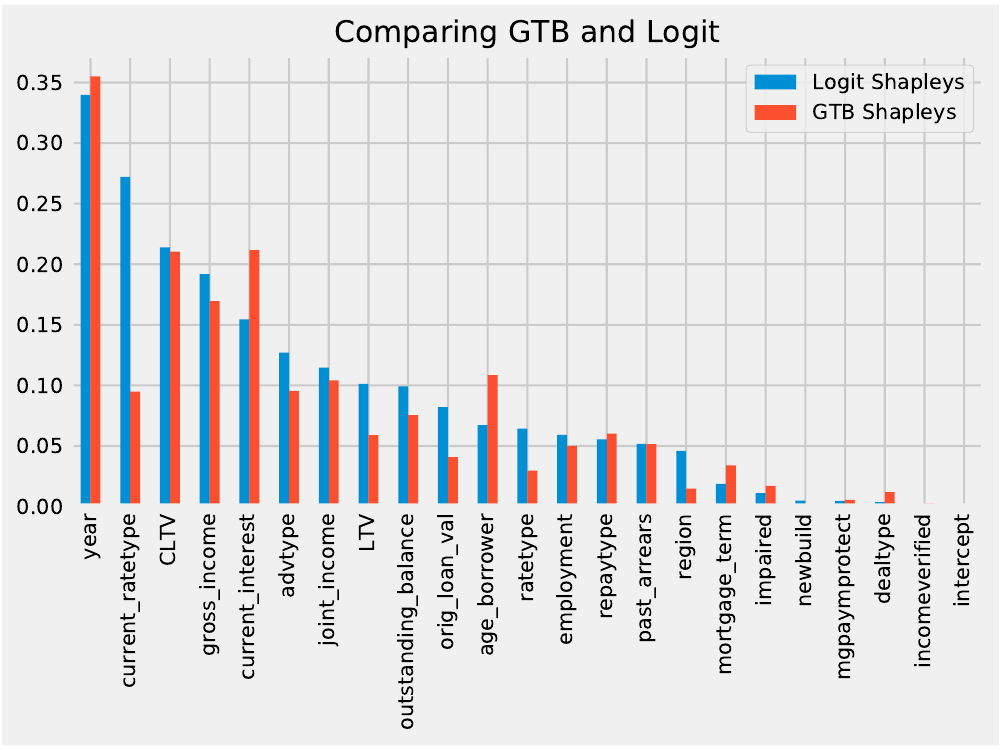
If we now compare the Shapley values of the two models, then the feature ordering is similar. But, the feature ‘current_ratetype’ was considered more significant by the Logit model. Such comparisons can therefore help justify the choice of model by your team.
Round 4: Explanations for stress conditions through simulations
We live in a volatile world where events like pandemics, wars, and environmental crises impact financial instruments. XAI becomes instrumental in predicting shifts in model behavior in case of stress conditions. Such conditions can be simulated through synthetic datasets.
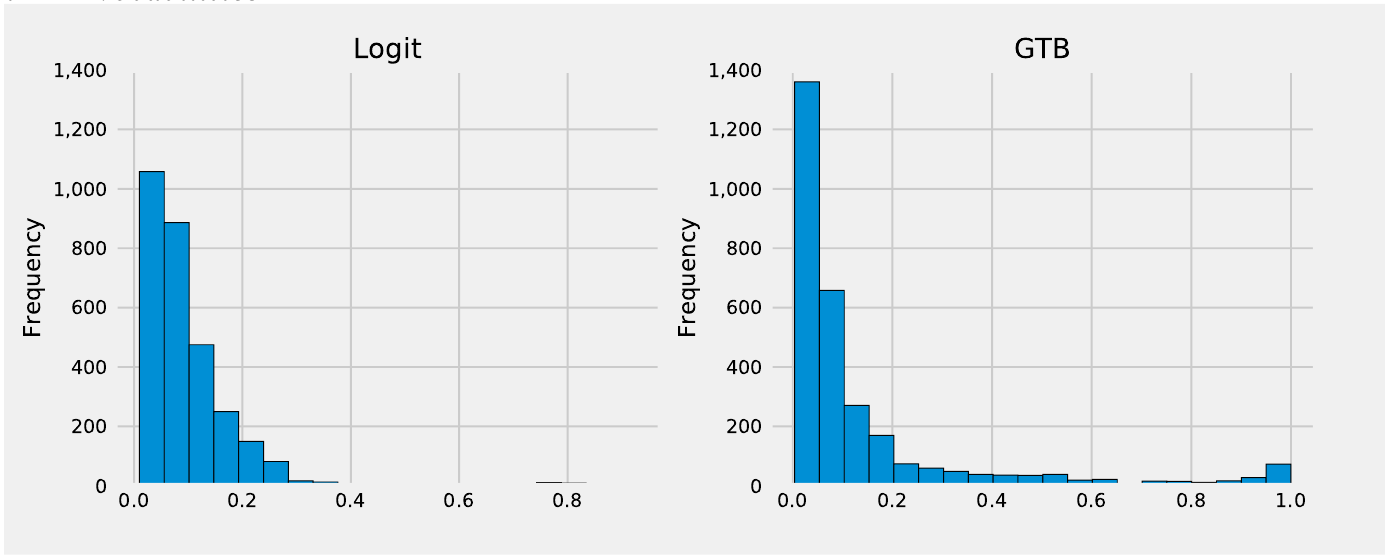
Both models predicted a higher probability of default for stress conditions, yet the extents differed. The prediction of the shift in default probability was more dispersed for the GTB model. It showed that a higher number of mortgages would span the extremes of low and high default risks. While the scenarios were hypothetical, explainability can be used to decide on more suitable models in view of real-world volatility.
How to get started with AI Explainability?
Various MLOps tools can help your team implement XAI in the project. Some of these include:
- SHapley Additive exPlanations SHAP supports different modeling needs to provide local as well as global explanations.
- Seldon Core is a platform that can elevate your model serving game. Apart from deployment offerings like canary tests, A/B tests, and request logging, the Alibi-based explainers cater to vast XAI needs.
- Another Python Package, ELI5 offers support for libraries such as XGBoost, scikit-learn, LightGBM, etc. This open-source tool brings transparency to the typical black box ML models.
Apart from the above limited tools, explainable AI companies like Censius offer comprehensive monitoring and explainability functions. The AI observability provided by Censius is powered by the trio of
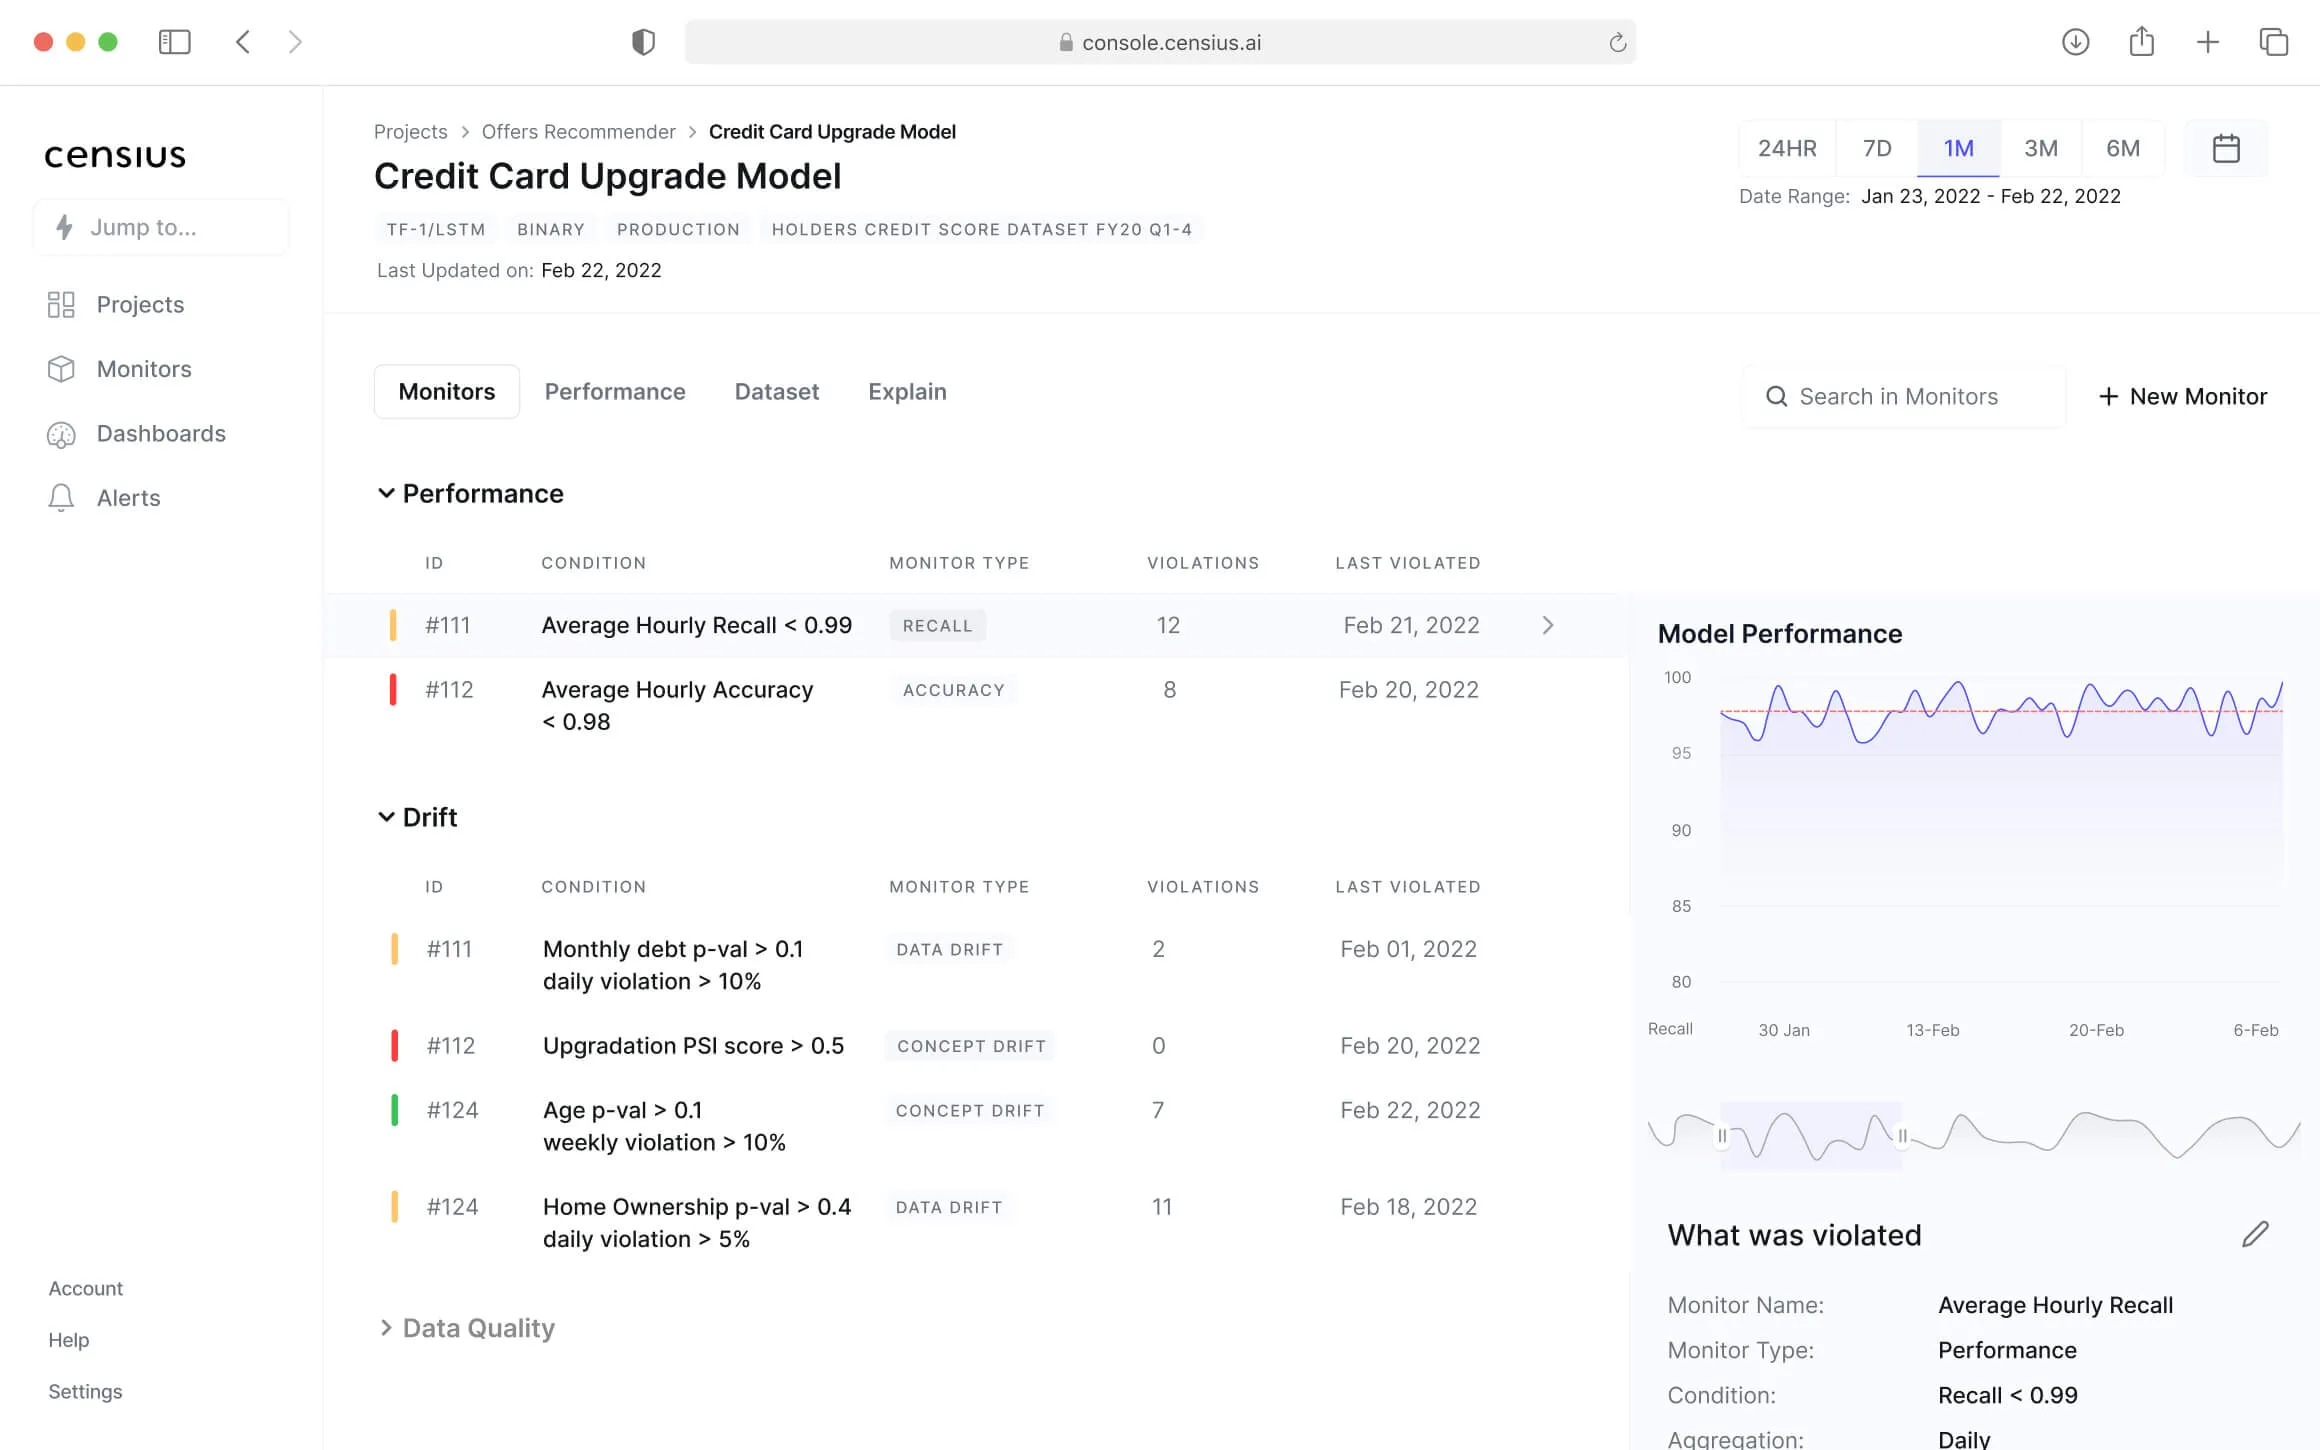
- Monitoring: Your team can set up combinations of monitors for model performance, data quality, and detection of drifts. Having interactive dashboards means you don’t need to write tedious code to set the monitors or process the alerts in case of violations.
- Explainability: In the above sections, we showed how explanations could help understand the reasons behind model behavior. The explanations are further helpful in case of behavior discrepancies and changes in the live environment. The detailed explanation reports by the Censius AI observability platform let your team troubleshoot with precision.
- Analysis: The customizable dashboard matches the dynamic needs of your business. Your team can easily modify the monitors and do RCA on the generated reports.
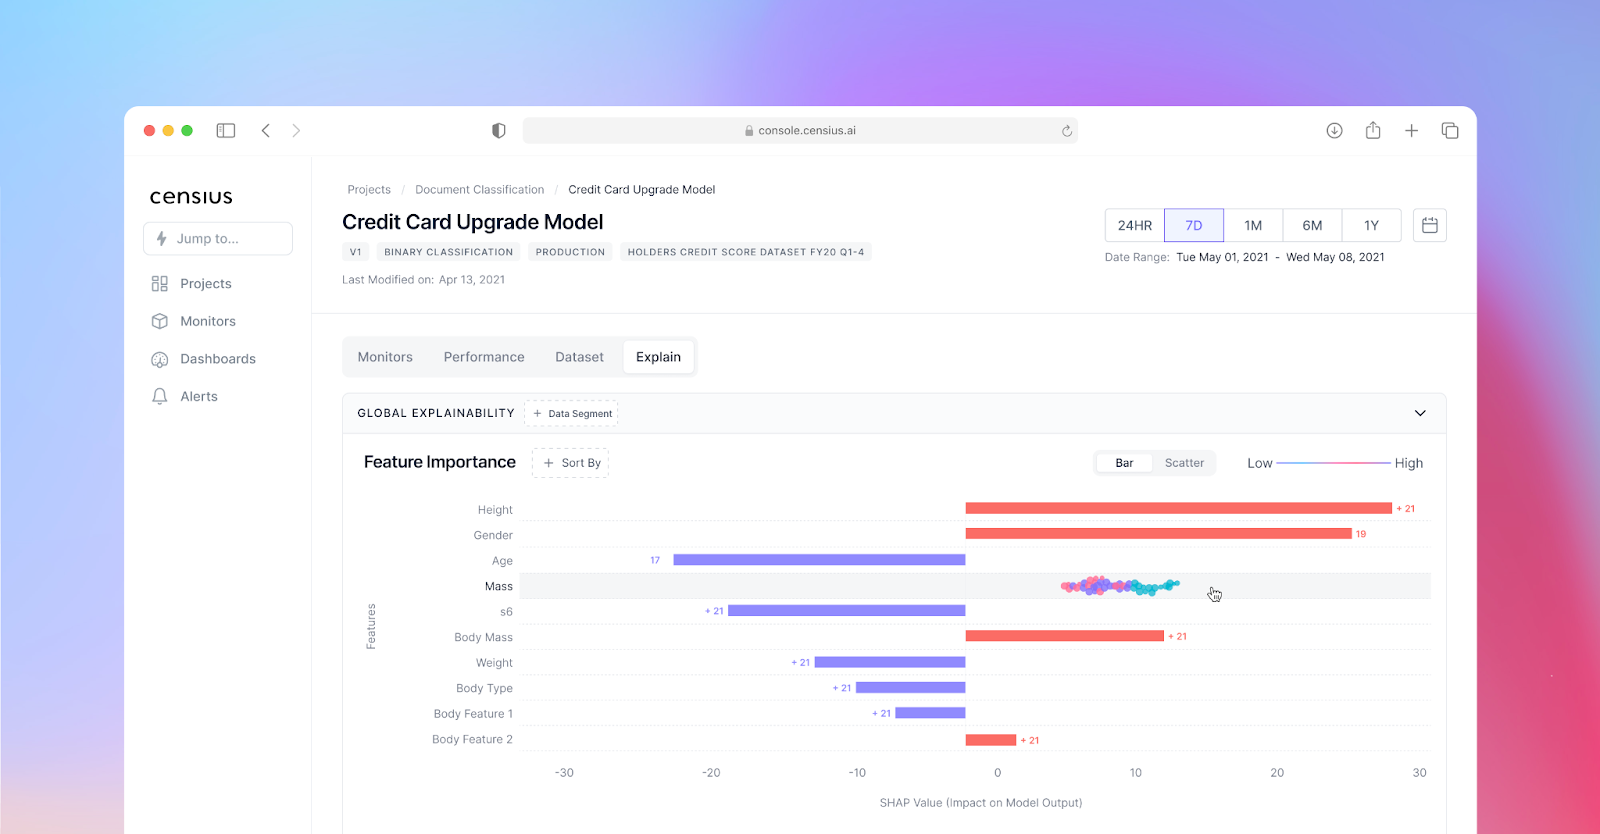
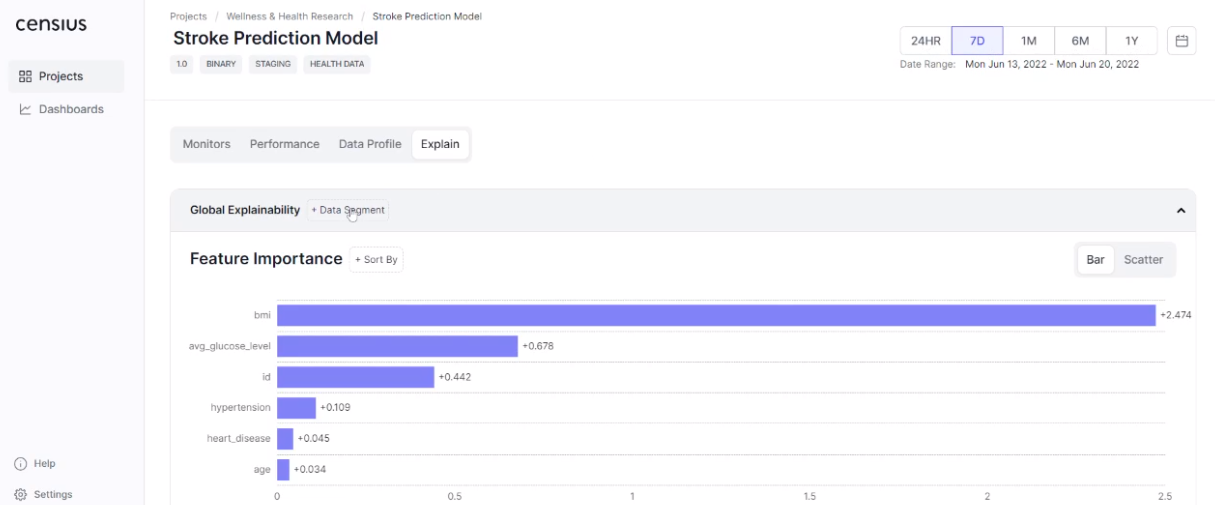
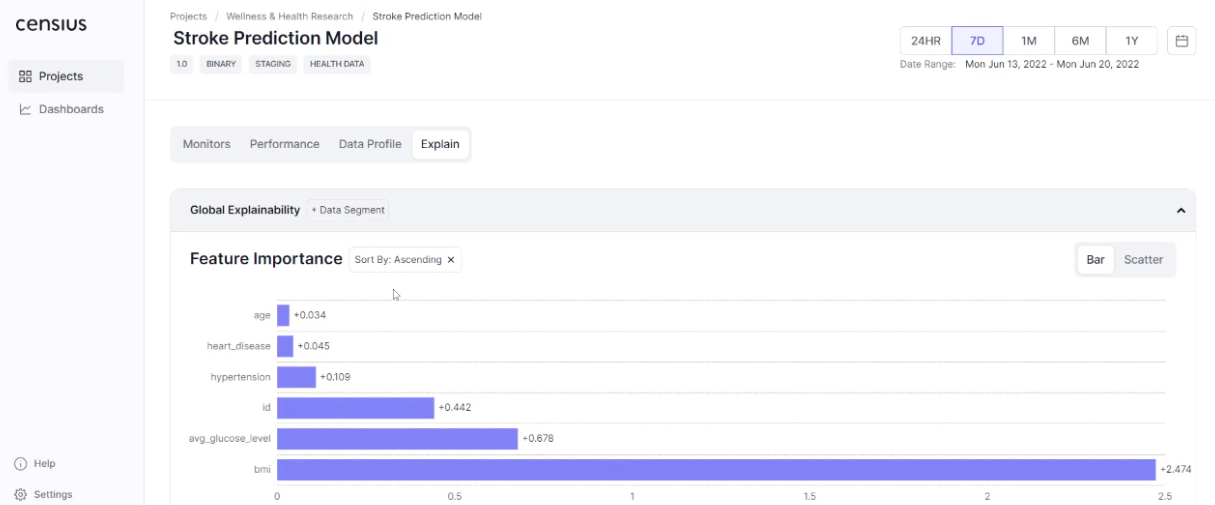
Another powerful XAI functionality offered by the Censius AI observability platform is cohort explainability. Suppose your model predicts chances of getting afflicted with stroke, and typical feature attributions may look like this:
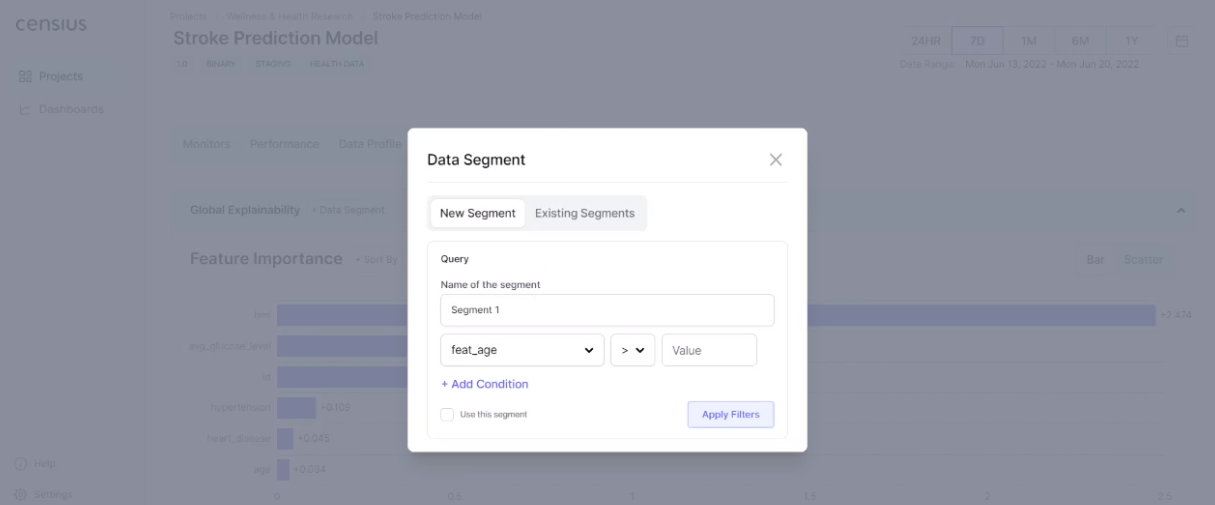
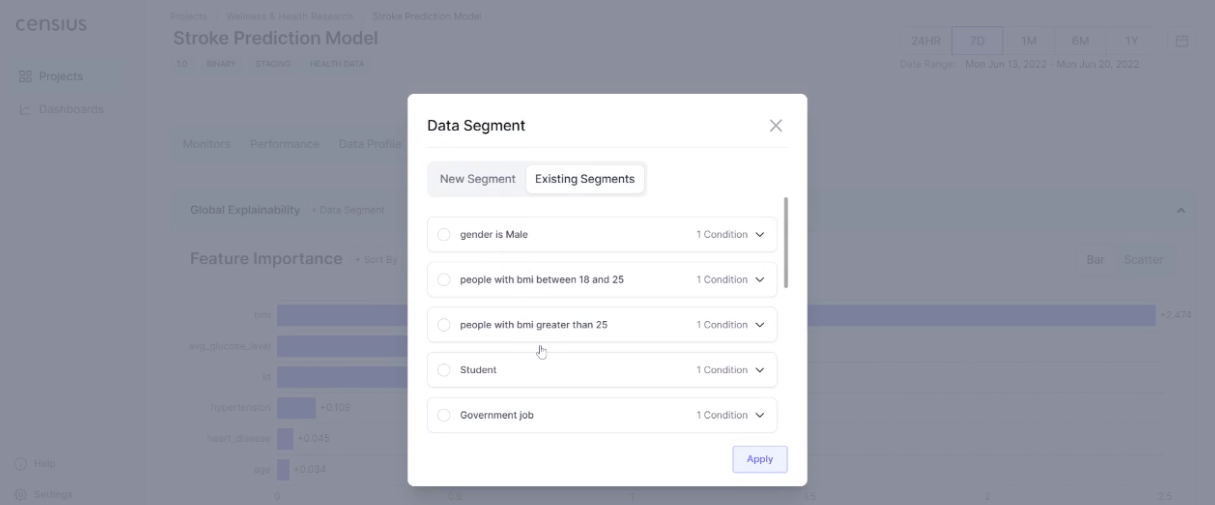
A deployed model will see data that is different from what it was trained on and may not perform for some instances. Cohort explainability at the Censius AI observability platform is realized through the selection of data subsets. For instance, you can check feature attributions for males in a specific age group or at-risk persons with high values of BMI. Your team can create a segment of interest or use the ones created earlier.
The selection of data subset of interest will now give you feature attributions relevant to the specific demography:
The additional benefit offered by the Censius AI observability platform is its relevance to different stakeholders. While dedicated XAI libraries are limited to the development and engineering teams, the reports generated by the platform are relevant to business executives as well. The transparent presentation of model decisions to the end-users is equally important to the business objectives. This is especially true for financial services since various stakeholders form the ecosystem and are affected by the functioning of AI solutions.
If we have stoked your curiosity on how the Censius AI observability platform can initiate your team to explainability and its benefits, you can delve further by requesting a customized demo.
Closing Thoughts
In this blog, we introduced you to the idea that explainable AI is crucial for financial services. The different aspects of model behavior are well presented if backed by numbers and explanations. Lastly, while there are a plethora of AI explainability tools to incorporate XAI in your projects, the likes of the Censius AI observability platform better caters to your business objectives. The flexibility of configuration and detailed reports can assist different stakeholders in understanding how the AI model is meeting their objectives.
To provide you with easily digestible tidbits of information, we also send out a newsletter that you can sign up for in the form given below.
Explore how Censius helps you monitor, analyze and explain your ML models
Explore Platform