
The basic premise behind any machine learning model is that the data used to train it represents real-world data. However, how can you prove this assumption after the model is in production? There can be several reasons for changing data (causing drift in data), which will affect your model performance. And, when drift is identified, you get to know that your model is operating in an unfamiliar environment, and it's high time to take action. As a next step, you need to analyze various factors like what is the size of the drift, should you be more concerned about it, and how often you need to look for the drifts in your data.
What is Model Monitoring?

Model monitoring is the crucial step for any machine learning process. After the model is sent to production, it's vital to properly monitor your model to track its performance. It allows you to pinpoint and get rid of various issues like bad prediction power, changing parameters over time, and poor generalization so that you deliver a good quality product with excellent performance. A proper model observation enables you to greatly impact real-world applications. We briefly discussed model monitoring, but what actually do you have to monitor? Any ideas? This blog is the correct place to answer this question.
What is Drift in Model Monitoring?
Imagine a scenario where you have created a model a few months back on the new data of that time, but now things have changed, and the data has advanced itself to a great extent. So how will your model behave now? Will it give the same success rate as it gave a few months back?
This situation is an example of model drift, so let us define it properly.
Model drift is when your model’s performance degrades due to changing relationships between input and output variables of the data. It is also known as model decay and is commonly observed by the end-users.
Let's look at the two significant types of drift:
- Concept drift: It refers to change in the relationships between dependent variables over time, i.e., there is a change in the relationship between the model's input (X) and output (Y), such that even if the input data remains the same, the result is no longer acceptable. For example, after a while, a model that predicts the price of houses based on their size and location will gradually lose its validity because it is logical that house prices rise over time. So the same house (same input) will have a different price (different output) in a few years.
- Data drift: It signifies that the input data's statistical distribution has changed, and as a result, the trained model is no longer applicable to the new data. It may still work on data similar to the old data, but it has become significantly less helpful when dealing with new data regions. For example, your model of a voice recognition system translates a user's speech into a transcript. As the system's acoustic qualities changed, you observed that the model's performance began to deteriorate. This change in the input data (audio) could be due to various factors, including linguistic changes over time, users using new abbreviations, new nationalities using the app, etc.
The difference between the two drifts is,
The model’s statistical features of the target variable are trying to forecast change in unexpected ways over time, known as concept drift. This raises issues because the predictions grow less accurate as time goes by.
This circumstance can negatively impact the workflow of any organization over time. To avoid this, organizations manage and monitor machine learning model performance. It can help you track your metrics and be aware of the drift in data consistency. It also simplifies identifying the business metrics affected by model drift.
Importance of Monitoring Data Drifts

It is difficult to make your model aware of all the data variants required to train it. Some data may be corrupted, some may be incomplete, and some may be affected during the various data-related processes part of the machine learning lifecycle. Every time, there will be some data quality issues that may not affect your current predictions but will indeed affect the future prediction on new data. That means your model is not safe, and that is why it is essential to monitor data drifts.
Handling drifts and automating the job for model retraining on new data will ensure that your model is doing good in production by giving fair results and avoiding biased predictions. Manual intervention may also help in such situations. These processes can be more optimized for efficient and successful deployment of the model to production.
Consequences of Ignoring Drifts
We have briefly discussed the importance of monitoring data drift, but what if drift detection gets neglected from the process and your engineering team does not identify it on time? In this situation, your model will give wrong predictions that will lead your business decisions based on model results to a wrong track, negatively impacting your business. An example of such a case could be incorrect stock predictions that could significantly drop your portfolio value. You may lose millions of dollars on the wrong stock prediction.
The effects of not handling the data drift on time depend on the nature and type of drift. In the case of data drift, straightforward cases can be managed by retraining the model on new data, but you may need to start from scratch in the worst case. The latter part will burn your time and efforts to a great extent.
So, it is crucial to have a repeatable process for identifying data drifts, defining a threshold on drift percentage, setting up alerts so that you can take appropriate actions on time.
How can Drifts be Detected?
It is crucial for any data scientist or ML engineer responsible for maintaining production models to keep a close eye and collate live traffic with the baseline. If any drift is caught, the next step is to identify the feature responsible for the drift. If a feature has low significance, the significant drift in the input feature may not affect the model's output. This is also known as spurious drift.
To identify significant data drifts, you may use,
- Sequential analysis methods like DDM (drift detection method)/EDDM (early DDM) that depend on the error rate to spot drifts.
- Model-based methods that use custom models for drift detection.
- Time distribution-based methods that utilize statistical distance calculation methods which help identify drifts between probability distribution.
Other popular statistical methods include Population Stability Index, Kullback-Leiber or KL Divergence, Jenson-Shannon or JS Divergence, Kolmogorov-Smirnov Test, or KS Test, Wasserstein Metric or Earth Mover Distance.
We will discuss each method briefly.
Methods of Detecting Data Drifts

Not choosing the right tool to detect drift can become tedious for ML professionals. Here are some of the algorithms used for this process.
Population Stability Index (PSI):
PSI compares the expected probability distribution in the present data with the expected probability in the training data. In simple words, it collates the target variable distribution in the test dataset to a training dataset used to develop the model.
Following are the steps for calculation:
- Sort the training data in descending order.
- Divide the test and training datasets into small buckets (10-20 groups).
- Define the boundary values for each group based on the minimum and maximum values of that column in training data.
- Calculate the percentage of observations in each bucket for both expected and actual datasets.
- Calculate the PSI using the below formula:
PSI = ((Actual% - Expected%) * ln(Actual%Expected%))
Kolmogorov-Smirnov Test:
This is a nonparametric test used to compare the cumulative distributions of the training dataset and the post-training dataset. It is a bit more complex than other tests and allows you to detect patterns you can’t detect with other methods. The null hypothesis for this test indicates that the data distributions of both data sets are identical.
Dn,m = supx|F1,n(x) - F2,m(x)|
Fn(x) = 12i=1nI[-,x](Xi)
where,
F1,n(x) = empirical distribution function of the previous data with n samples
F2,m(x) = empirical distribution function of the new data with m samples
supx= subset of samples x that maximizes |F1,n(x) - F2,m(x)|
Kullback–Leibler Divergence:
Kullback–Leibler Divergence is also referred to as relative entropy. It measures the variation between two probability distributions. This test is practical when one distribution has a high variance with a relatively small sample size to the other one. For example, if there are two distributions, P and Q, where P is old data distribution and Q is the new data distribution, then we would calculate it as:
KL(P||Q) = - xQ(x) * logP(x)Q(x)
where,
‘||’ signifies divergence.
The KL divergence score can vary between 0 to infinity, where a zero score means that the two distributions are identical. The log base 2 of the formula will give the result in 'bits,' and the formulas’ natural log (base e) will provide the result in 'nats.'
JS Divergence:
JS stands for Jensen-Shannon Divergence. This test is used for measuring the similarity between two probability distributions. It is based on KL divergence, except that JS is symmetric and has a finite value. Following is the formula used in JS divergence:
JS(Q||P) = 12(KL(Q||M) + KL(P||M))
where,
M = Q+P2
How can You Prevent Data Drifts?
Keeping track of the data drift is essential to industrialize the machine learning process. Applying the MLOps approach is a great way to handle and control the data drift for good maintenance. This allows data managers and engineers to get alerted about the existing data drifts and predict it as soon as possible before the problem gets worse and forces you to make heavy changes on your machine learning model. Still, monitoring the ongoing data drift can be time-consuming and tedious for the data teams.
A proper MLOps approach sets up a governance framework across the lifecycle that helps the organization make these models work technically and operationally. It lets you more efficiently and effectively manage your data and model operations.
It enables you to appropriately use the ML algorithms for teaching systems to identify and classify data today and learn new data in the future using effective techniques. These decision-making ML algorithms help businesses recognize patterns that predict consumer preferences, identify different fraud, monitor your financial performance, and re-analysis the customer experience.
Following are the four elements of an effective MLOps process:
- Model versioning: With various datasets, you may require to retrain your model to fix the same business problem. To keep track of the same model on different datasets or algorithms, you need to have different model versions. Also, it is essential to create results that can be reproduced.
- Constant monitoring and training your models: It is crucial to continuously monitor and train your model performance to ensure that your model produces correct results. Monitoring helps evaluate model output and track drift and effectiveness over time.
- Model governing: It is crucial to maintain model lineage, explanations, auditability, and business consequences by governing them.
- Retraining and redeployment: At the time of model drift, you need to be prepared for retraining the model on new data and then redeploying it. Drifts like data drift can have severe negative impacts on any organization looking to improve its business with machine learning. On the other hand, performing flexible machine learning operations with best practices for continuously monitoring and retraining your models on new data can go a long way in avoiding these severe issues.
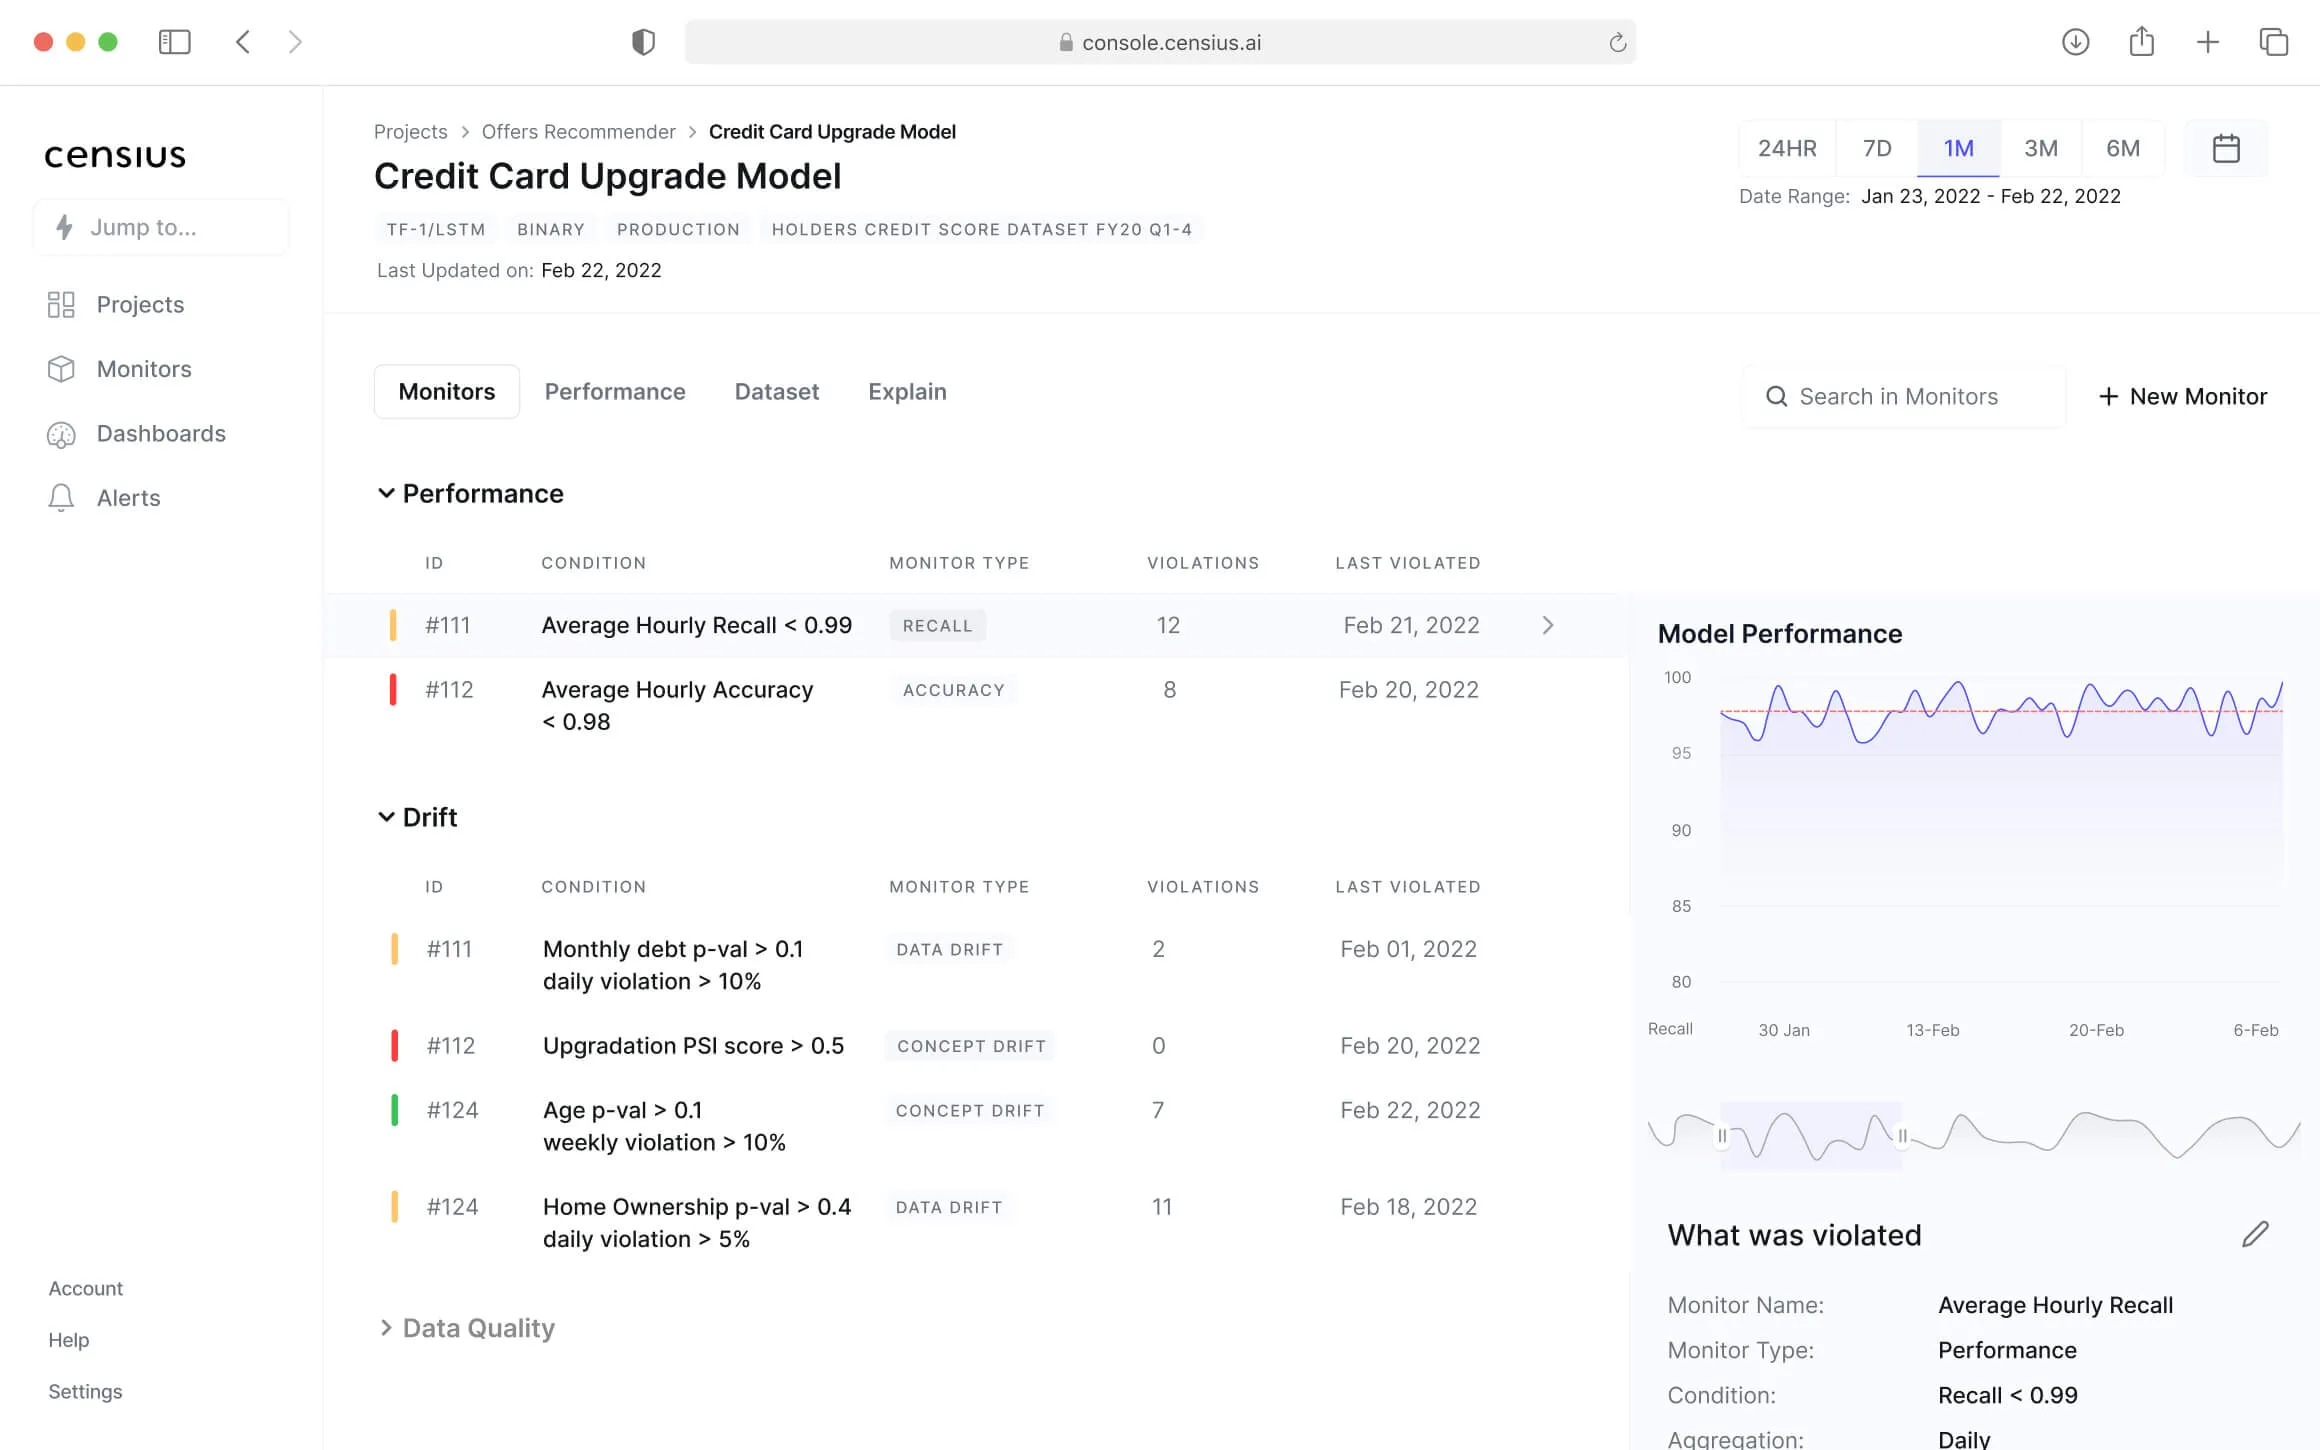
Solving Drifts with Censius AI Observability Platform
As discussed, the process of machine learning model observability is the foundation that empowers ML teams to continuously deliver an excellent product to the end-users and improve results from the lab to production. Censius AI Observability Platform makes this simpler by monitoring the ML pipelines, analyzing issues, and explaining how the model makes decisions. You can automatically monitor and identify the drifts before it's too late. Additionally, it lets you do the root-cause analysis to understand model anomalies. It is helping several data scientists, ML engineers, and various business stakeholders to achieve their goals every day.
The steps to begin with the Censius observability platform are:
- With just a few lines of code, you can register your model, log the features and capture the model prediction.
- You can choose from dozens of monitor configs to track the entire ML pipeline.
- You can then track the models and perform analysis without any line of code.
- Sit back, as your entire ML pipeline is monitored, and you can run thousands of monitors with any additional engineering effort.
Following are the features of the Censius AI Observability platform:
- It will continuously monitor the model input & output, track various drifts like prediction, data, and concept, check for data integrity across the pipeline, and provide real-time alerts for monitoring violations.
- It will track the model's health using its intuitive interface. It also helps in monitoring the performance across different model versions. Based on the observations, you can view the evaluations and historical performance of the model on its customizable dashboard.
- It lets the teams analyze and ship the models with better performance while being compliant and avoiding any bias to creep in.
Conclusion
In this blog, you got a brief introduction about the model monitoring process and how drifts degrade your model's performance. You also learned how to detect data drift and the consequences of ignoring it. At last, you came across the Censius AI Observability Platform, which can easily help you monitor drifts and explain your model's decision-making in production.
Explore Censius AI Observability Tool
Explore how Censius helps you monitor, analyze and explain your ML models
Explore Platform